Oscillation analysis through images
The analysis of mechanical oscillation is currently a well-developed technique, however, the conventional methods present limitations. Alongside the development of oscillations measured by images, the potential for further development of engineering solutions increased considerably.
The usage of oscillation analysis systems is not only responsible for reducing maintenance costs, it also assists technicians and engineers to improve their knowledge and, consequently, start to define the improvements which should be introduced into machines in order for them to become more reliable and wear resistant. Continue reading and learn more about this methodology.
Oscillation studies
The oscillation studies is extremely important for modern engineering as it is through its use in machinery and equipment that it is possible to become acquainted, improve and gain considerable improvement in quality, productivity and development.
When a new equipment is put into operation, it is expected that it will have a long lifespan and that it presents the smallest amount of non-conformities possible. However, design deficiencies, specification errors, manufacturing, transportation, installation, conditions, operation and maintenance can make equipment and installations unreliable.
Often the mechanical defects arising from the equipment’s operation have specific frequency wave width within the spectrum which can, in turn, incur certain flaws. These bands have multiple and submultiple parameters of the equipment’s operating rotation, or excitation. In the following Figure, an oscillation spectrum is presented, with the frequency wave width divisions.
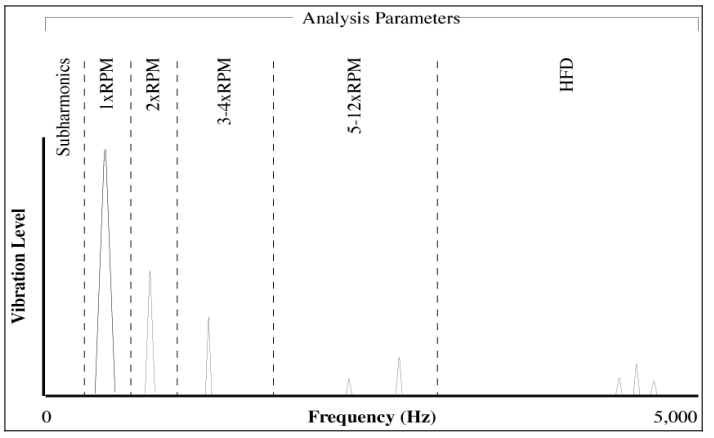
According to the Figure, it is possible to observe that often the frequency which culminate in mechanical flaws are connected to the defects as follows:
- 1 x RPM = Unbalancing;
- 2 x RPM = Misalignment;
- 1, 2, 3, 4 e 5 x RPM = Mechanical gaps;
- 0,5 x RPM = Excessive friction between.
It is important to emphasize that most oscillation measuring systems use accelerometers which enable a suitable performance in an ample frequency strip.
Even though it responds to the wide range of situations, accelerometers usually perform marginally to frequencies below 2 Hertz or 120 CPM due to the high quantity of noise generated by the Fast Fourier Transformation.
Unfortunately, a considerable amount of the issues linked to the mechanical system’s resonance, fixation issues in bases and structural instability are problems which manifest themselves in low frequencies, usually below 2 Hz. Thus, the proper characterization of these phenomena was uncertain and often wrong, which in turn would generate expensive repair costs that were not assertive.
ODS analysis
According to SCHWARZ and RICHARDSON (1999), overall, the Operational Deflection Shapes (ODS) is defined as a deflection of a structure in a specific frequency. However, an ODS can be broadly defined as any forced movement between two or more points within a structure. Thus, the movement of two or more points defines a shape.
Accordingly, a shape is the movement of a point in regard to the others. Therefore, the movement is a vector quantity and thus has location and direction associated with it. This is called the Degrees of Freedom (DoF). The six kinds of DoFs that describe the movement’s behavior of an object can be seen in Figure 2.
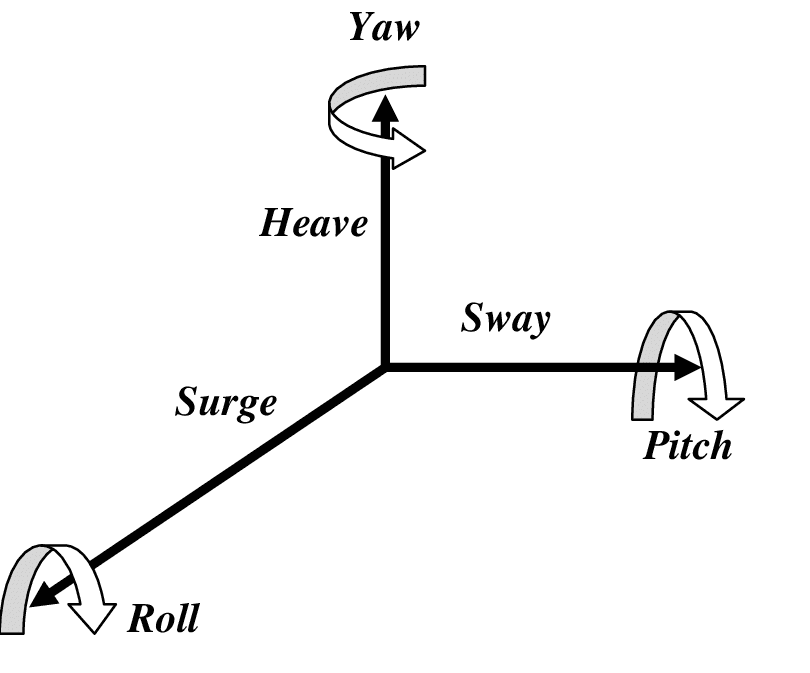
According to RICHARDSON (1997), a DoF can be defined starting from any forced movement, either within a moment in time or a specific frequency.
Therefore, a DoF can be obtained from different kinds of responses to a time domain, whether they are random, impulsive or sinusoidal. A DoF can also be obtained from the various kinds of different measurements of a frequency domain, including linear spectrum (FFTs – Fast Fourier transform), cross and automatic power spectra, FRFs (Frequency Response Function), transmissibilities and a special type of measurement called DoF FRF.
According to GANERIWALA, SCHWARZ and RICHARDSON (2009), overall a DoF is defined as a magnitude value and phase for each GDL which is measured within a machine or structure. Said methodology requires that all the responses be measured simultaneously or be measured in conditions which ensure the correct magnitude and phase in regards to each other. The simultaneous measurement requires a multichannel acquisition system that can acquire simultaneously all the answers. And it is precisely there that the image treatment solution proposed by KOT stands out.
Oscillation measurement through image treatment
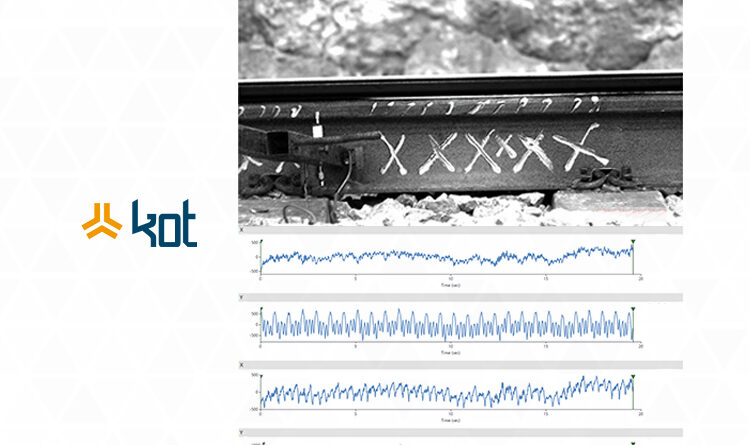
One of the most promising options to solve low frequency and the multichannel measurements is through the performance of oscillation tests by high speed camera systems in which short films are created to measure the actual structure’s displacement. These films are then treated by specific software and have, as a final result, the forms of waves, the oscillation spectrum and the amplified videos.
These image-based oscillation measurement systems are composed by:
- high speed camera to acquire the images;
- Camera lenses;
- Support and illumination systems;
- Computer for the acquisition and further film treatment.
With this system we can measure the structure’s displacement and the shapes of the waves originated from specific points according to the applied load.
Through this camera it is possible to measure various points simultaneously, as long as they are framed in the same image, without the need for value interpolation. Additionally, it is not necessary to stop the equipment in order to install the sensor and the measurement is done from a safe distance of the asset. One case for the use of the camera by KOT can be seen on Figure 3 below:
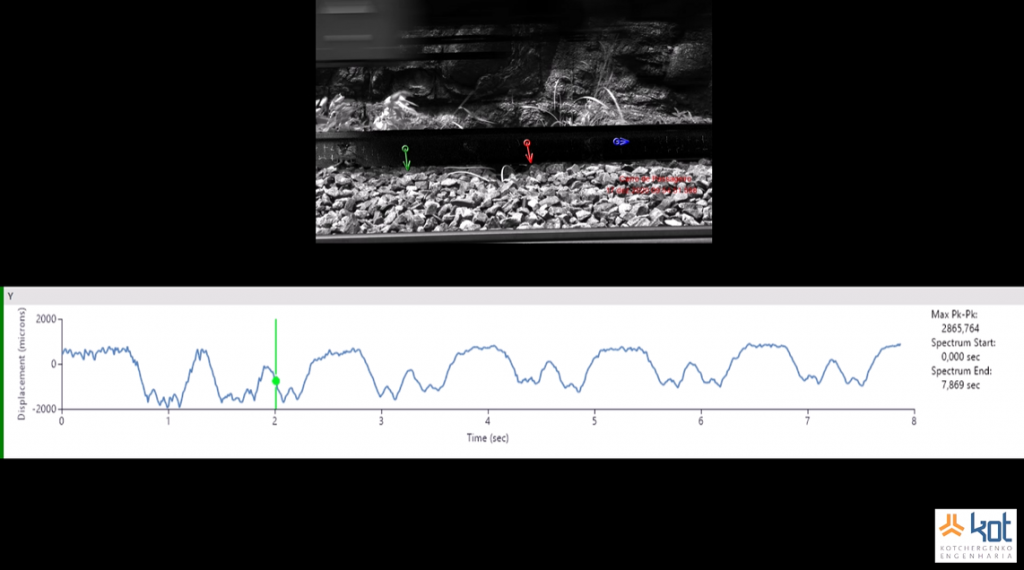
Finally, with the oscillation analysis system, the data analysis is extremely important and very dependent on the qualification of the oscillation analysis team. A suitable solution to the problem will only be possible with a trained and qualified team. If your company needs oscillation analysis, get in touch with our consultants and we will gladly assist you!

Aender Ferreira
Mechanical Technician from CEFET-MG, Mechanical / Aeronautical Engineer from UFMG and Master in mechanical projects from the same university. Before graduation, he had experiences in the mining, maintenance, project design, experimental engineering and automotive industries. As an Engineer, he started his career in the maintenance sector performing calculus activities for fatigue in aeronautical components and structures. Subsequently, he was invited to compose the Board of Directors of KOT Engineering, working in the commercial sector of the company, helding the position for almost 15 years.
References
BERRY, James E. Technical Associates of Charlotte.
SCHWARZ, Brian J.; RICHARDSON, Mark H. Introduction to operating deflection shapes. CSI Reliability Week, v. 10, p. 121-126, 1999.
ZENG, Hansong. Bio-Inspired Inertial Sensors for Human Body Motion Measurement. 2012. Tese de Doutorado. The Ohio State University.
RICHARDSON, Mark H. et al. Is it a mode shape, or an operating deflection shape?. Sound and Vibration, v. 31, n. 1, p. 54-67, 1997.
ASNAASHARI, Erfan; SINHA, Jyoti K. Operational deflection shape for crack detection in structures. In: Key Engineering Materials. Trans Tech Publications Ltd, 2013. p. 1085-1092.
GANERIWALA, Surendra N.; SCHWARZ, Brian; RICHARDSON, Mark H. Operating deflection shapes detect unbalance in rotating equipment. Sound and Vibration, v. 43, n. 5, p. 11-13, 2009.


Leave a Reply