Successful Case: Composition of a cooling bed
Introduction
The discrete element method (DEM) is a tool used to simulate the behavior of bulk materials, regardless of shapes and sizes. It can be used in equipment such as silos, hoppers and transfer chutes. This method allows the asset operation to be numerically represented, after correlating the model and the data of the under-analysis equipment. Thus, it becomes possible to identify flow patterns and physical parameters that would be difficult to obtain during operation. In addition, DEM also enables the study of changes in geometry and operating parameters, all without the need to stop the equipment or use physical prototypes.
Case
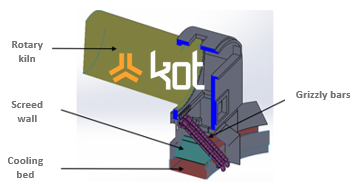
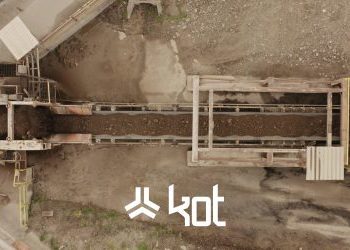
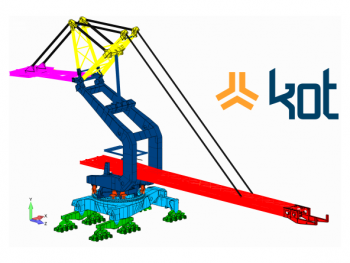
At the request of a customer, Kot Engenharia used the method to perform flow analysis in a cooling bed, used for iron ore pellets. This study aimed to identify possible causes for insufficient cooling in a segment of material along the cooler. Figure 1 presents the equipment, as well as its main components, related to material flow.
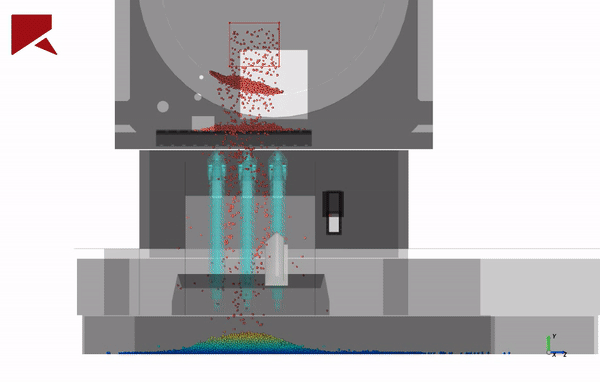
Based on reports from the operation team and on images obtained in the field, it was observed that a portion of the material was not being cooled correctly at the exit of the cooling bed. With this, it was possible to notice that the material at high temperature was close to the external wall of the cooling bed on a recurring basis, as shown in Figure 2.

Regarding the material used in the model, since it is not possible to collect and handle the pellets in the operating condition, the DEM model was calibrated using the material data at room temperature. Figure 3 shows one of the views comparing the trajectory of the pellets at the exit of the oven with the trajectory of the material in the DEM model.

After the process and equipment evaluation, two hypotheses were raised for the material range that was not being cooled as expected. The two possibilities considered are:
- Irregularities in the height of the material bed;
- Non-uniformity in the porosity of the pellet bed.
The DEM model executed to evaluate the formation of the pellet bed, which can be seen below, in Video 1, presents the filling stage and the start of the cooler’s operation.
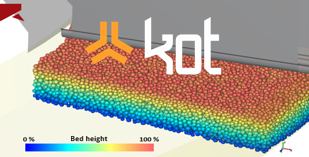
This model aimed to identify the height of the bed of material along the width of the bed. With the results of the DEM analysis in hands, it was possible to identify the uniformity in height, as shown in Figure 4.
After discarding the possibility of variations in the height of the bed, the next hypothesis was to evaluate the non-uniformity of the porosity of the pellet bed. As per customer reports and post-cooler bulk material sampling data, the cooling problems were related to an increase in the fraction of finer particles.
The possibility of segregation by particle size at the exit of the furnace is known, which results in predominantly different trajectories for each pellet size, therefore causing the formation of a non-uniform bed. If there is a greater presence of fine particles in a specific region of the cooler, the air flow in this section would be impaired, hence the heat exchange capacity of the pellets in this segment would also be reduced.
Therefore, a greater variability of particles was implemented in the DEM model, following the proportion of granulometric distribution informed by the customer. Figure 5 presents the flow analysis in the model as a function of the particle diameter.
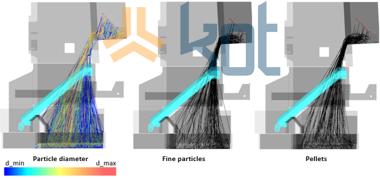
The model with greater granulometric variability indicated that the particles of smaller diameter have a tendency to fall on the external side of the cooling bed, coinciding with the region of material’s worst cooling. Thus, the composition of the bed was evaluated and the number of particles in each radial segment of the bed is shown below, in Video 2. This parameter is related to the porosity of the bed, since a region with a greater number of particles implies in greater filling of the volume of this section and consequently in a smaller void fraction.
Conclusion
The analysis of the pellet bed using a DEM model indicated that the section with the highest number of particles and, consequently, the highest porosity, coincides with the region of worst cooling, highlighting this factor as the cause of the problems reported by the customer.After the identification of the problem’s origin, using computational calculation tools, Kot was able to support its customer to obtain the necessary information for the development and application of the solutions. Furthermore, it was possible to optimize the use of resources and enable significant improvements in its process.
Kot’s team has qualified professionals at your disposal to evaluate and carry out the most diverse consulting engineering analyses. Consult our professionals for more information!
KOT Engenharia’s Team
With over 29 years of history and various services provided with excellence in the international market, the company promotes the integrity of its clients’ assets and collaborates in solutions to engineering challenges. For this integrity, it uses tools for calculation, inspection, instrumentation and monitoring of structures and equipment.


Leave a Reply