
What is ODS?
The last article published on KOT’s Blog covered concepts such as: concrete, building pathologies, sclerometer, extensometry and carbonation.
What is ODS (Operating deflection shade) and how can it be used to solve structural non-conformities?
Operating deflection shade (ODS) is a method that can be used to measure acting vibrations on an equipment or structure, during its operation.
In general, vibration analysis’ main objective is to guarantee the availability for operation, safety and structural integrity of a component, equipment or structure. A machinery in operation generates vibrations, and even if it is out of operation, it may vibrate because of the excitation by an external force (by a wind load, for example).
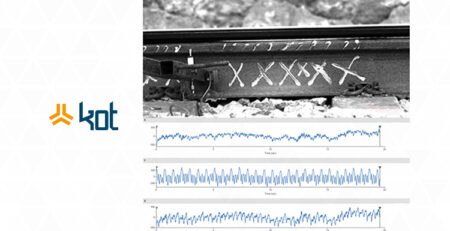
In the fieldwork’s day-to-day, vibrational analysis is performed by collecting the vibrations that these equipments are subjected to. The data is collected through the use of accelerometers, that vibrate, and when they do it, they generate low-current electrical signals that are read by a data acquisition system. Such data are processed through specific algorithms, enabling vibration analysis.
Nowadays, this vibrational analysis can take place on-line (with the accelerometers mounted directly and permanently on the object) or off-line, with the engineer collecting this data in the field.
Through the data processed by the algorithms, those involved in the process seek to prematurely detect failures or investigate the reasons for failures already known. Among the most common problems found in the field in the company’s day-to-day activities, which can cause inconvenience due to vibration, the following stand out: cavitation in pumps; electric motor failures; gearbox failures; imbalance, bearing faults, misalignment, resonance; among other inconveniences.
The ODS is a methodology used in everyday vibration analysis. For better understanding, some academic concepts are important to remember:
Degrees of Freedom (DOF):
As determined by RAO (2009), the most simplified system for vibrational analysis is the model with one DOF, whose movement is determined by a specific coordinate or variable. Therefore, the DOF is the minimum number of coordinate points required to determine system’s positioning and movement of.
Free vibration:
Free vibration is characterized when a given object suffers an initial perturbation and, after this moment, it continues to vibrate on its own, without any external force resulting in additional vibrations to the system. The classic example of free vibration is a simple pendulum. After its displacement to the starting point and its release, an oscillatory movement begins without any action of external forces.
Forced vibration:
Forced vibration differs from free vibration, since in this case external forces act on the system under study. The classic example of forced vibration is the rocking chair, which after an initial perturbation needs a continuous one so that the oscillatory movement of the child in the swing continues.
In the day-to-day of industry, unbalances in components subjected to rotation such as pulleys, flywheels, fans, among others, are common examples. In practice, forced vibration can be caused by factors such as: breakage of a certain component that can excite the structure at a different frequency (breakage of a gear tooth of a reducer, for example); inadequate structural design; misalignments in the structure above the foreseen in the project; unforeseen external and/or environmental excitations; unbalanced masses during component manufacture (unbalanced masses in pulleys, drums, flywheels, fans, etc.).
Natural frequency:
It is the characteristic frequency or its particular set of a given object in free vibration situation. This frequency is determined by factors such as geometry, mass, dimensions and materials involved in the formation of the object under study. For simple objects, a relatively easy way to obtain the natural frequencies is to excite the object and then put it in free vibration, with the only external load being gravitational. This way, the natural frequency can be measured by suitable instrumentation.
Modal analysis:
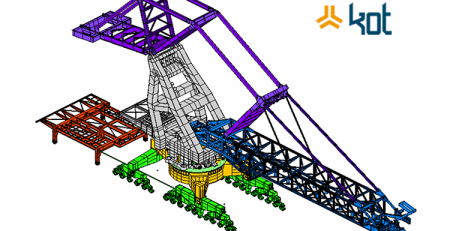
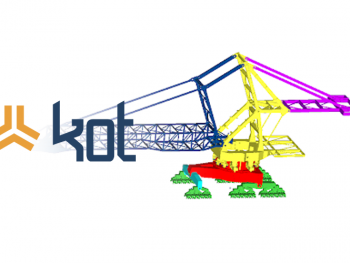
For complex equipment and structures (stockyard machines, conveyors, steel-framed buildings, etc.), a modal analysis must be performed to find the natural frequencies of the structure. For this evaluation, parameters such as rigidity and mass of the object under study are used. Modal analysis is an important tool for promoting the structural integrity of an asset, whether during its design or during its operation. When the natural frequencies of the object are known, their sources of excitation must be investigated then. Some examples of these sources are motors, gearboxes, sieves and rotating equipment in general that interface with the system. Thus, the occurrence of the resonance phenomenon can be avoided. Gif 1 presents a modal analysis performed by KOT.
It is important to note that, through this analysis, the modal response of the object is obtained, in which each natural frequency is associated with a mode, a way of vibrating (shape). For field analysis of a system that has several sources of excitations, ODS analysis is recommended and can contribute to modal analysis, especially in cases where there are overlapping frequencies. In these cases, resonance in multiple structural modes is possible.
Resonance:
This phenomenon occurs when the frequencies of the excitation sources in the equipment, structure or nearby regions are close to or equal to the natural frequencies of the system under study. When this occurs, if it is not damped, the object under study/analysis may present high displacements that, many times, were not considered in the equipment design. Such displacements can cause phenomena such as low cycle fatigue, reduced component useful life and even structural collapse of the object. Gif 2 shows the notorious case of the Tacoma Narrow Bridge in resonance, caused by wind loads.

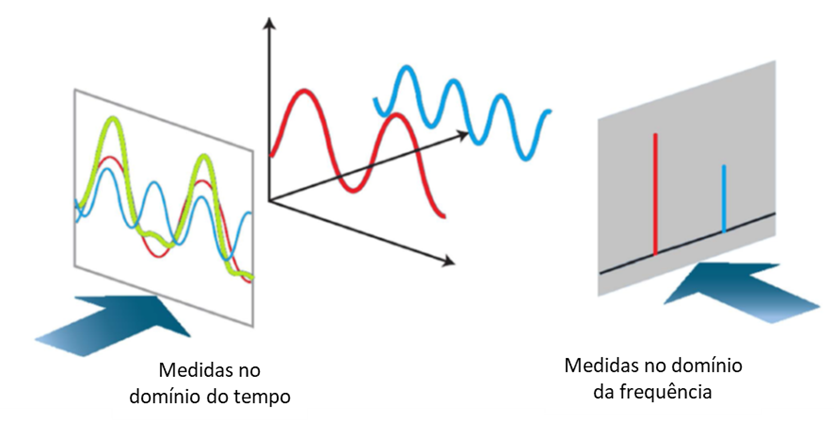
Time domain:
In order to facilitate understanding, the vibration in the time domain can be interpreted as the sum of all vibrational contributions acting on the equipment undergoes over time. Thus, the sums of each equipment can be perceived, and in practice they correspond to the vibration that the human body feels when it is on a vibrating object. As an example, when an employee is on a belt conveyor, it is the vibration that he perceives on the walkway. It is the sum of the vibrations of the motor, gearbox, drums, belt, rollers, wind load, among others, interacting with each other.
Frequency domain:
When the frequency domain is analyzed, it is possible to separate the contribution that each component of the vibration presents in the object. In order to clarify this matter, MASTRIANI (2018) presents in Figure 1 a comparison between the time domain and the frequency domain. On the left side, you can see the vibration of two components acting on the object and the resulting vibration that represents the analysis in the time domain. On the right side of the figure, the separate contribution of the two components can be analyzed, which configures the analysis in the frequency domain. Thus, on the left side the amplitude of the signal in the time domain is perceived, and on the right side the amplitude of the signal in the frequency domain.
Fast Fourier Transform (FFT):
The FFT is a mathematical device that serves to discretize vibrations from the time domain to the frequency domain. In practice, an algorithm is developed to carry out this transformation in order to process the collected data, or a specific commercial software is used to carry out this data processing.
ODS:
As defined by DOSSING (1988), ODS (Operating Deflection Shape) can be measured on a given object directly, by relatively simple means. This methodology provides very useful information to understand and evaluate the dynamic behavior of a component, equipment or structure.
RICHARDSON (1997), has the following definitions for ODS:
- ODS is defined as the deflection of an object (structure, component or equipment) at a specific frequency. More generally, methodology can be defined as any forced movement of two or more points on an object. In this context, when the movement is determined from two or more coordinates, it is thus possible to define a form of deflection (shape);
- A shape is the movement of one point coordinated with respect to all others. In this context, motion constitutes a vector quantity, having location and directions associated with it. This vector quantity is also known as an important concept in the study of vibrations known as DOF;
- The ODS can be set and determined from a specific displacement of a forced vibration, either at a specific time or at a specific frequency. Therefore, the ODS can be obtained for various types of responses in the time domain, whether these responses are sinusoidal, punctual or completely random.
In practice, how can the ODS contribute to the structural integrity of your asset? KOT suggests the following steps for attending when the customer is faced with a new phenomenon that harms human comfort and/or may bring damage to their asset:
- Based on the client’s report of his asset, the entire system involved is studied through drawings (structural, civil and/or mechanical), as well as the battery limits for the definition of the model. In this study, frequency ranges and possible excitation sources are raised for solution planning. It is important at this stage that the engineer has a clear knowledge of the equipment’s history and operating conditions performed, especially when the unwanted phenomenon of vibration occurs;
- It is defined whether or not to perform a modal analysis to investigate the phenomenon;
- With previous study the accelerometers that will be used are defined, as well as the electronics available with the compatible number of channels. Collection points are also defined and any deviations that may occur during the tests are raised for mitigation;
- Data collection is carried out in the field with specialized electronics to meet the demand. The equipment must be in the conditions in which the phenomenon of inconvenient vibration occurs, so that the model reproduces reality. Other frequency and operation bands can be explored, in order to detect other future hidden non-conformities;
- Returning from the field, having specific mathematical tools for this application, the data are processed and analyzed. The information obtained in the pre-study performed is compared with the data collected in order to carry out the diagnosis of the phenomenon. In this confrontation several questions are asked, such as: what are the directions and displacements that the asset performs; what is the behavior of the structure when excited; what are the differences in displacement of the various points of the asset from each other; which sources of excitation contribute most to the perceived phenomenon, among others;
- Understanding the studied and analyzed data, a report is presented with the diagnosis obtained, as well as the actions required to resolve the inconvenience found.
Conclusion
If your business needs ODS solutions and vibration analysis to promote the structural integrity of your asset, get in touch. KOT has qualified professionals and specific equipment available to contribute to the solution for your equipment. We’ve been here since 1993, boosting our clients’ results.
KOT Engenharia’s Team
With over 29 years of history and various services provided with excellence in the international market, the company promotes the integrity of its clients’ assets and collaborates in solutions to engineering challenges. For this integrity, it uses tools for calculation, inspection, instrumentation and monitoring of structures and equipment.
References:
[1] MASTRIANI, Mario. Quantum-classical algorithm for an instantaneous spectral analysis of signals: a complement to Fourier Theory. 2018;
[2] RAO, Singiresu S. Vibrações mecânicas. Pearson Educación, 2009;
[3] DOSSING, Ole. Structural stroboscopy-measurement of operational deflection shapes. Sound and Vibration Magazine, v. 1, p. 18-24, 1988;
[4] RICHARDSON, Mark H. et al. Is it a mode shape, or an operating deflection shape?.Sound and Vibration, v. 31, n. 1, p. 54-67, 1997.


Leave a Reply