Introduction
Today, Industry 4.0 continues to bring countless innovations to the manufacturing sector. Furthermore, these innovations span all areas of engineering and encompass a wide range of research fields and potential applications. In this regard, one of the innovations is digital simulation, and according to SENAI, the term can be defined as “In clear and direct terms, it can be described as the virtual reproduction of manufacturing development and production processes and environments.” [1].
Furthermore, railway assets are subjected to significant stresses, whether due to the heavy loads they carry, the high vibration levels inherent in these systems, the long distances traveled by trains, or a combination of these factors. For this reason, it can be concluded that analyses of these systems are highly beneficial and can yield valuable results. Thus, in this text, explore a project involving instrumentation, data collection and analysis, and digital simulation of a railway shock and traction system, carried out by the Kot Engenharia team!
In order to evaluate and study the structural conditions of the coupling in different positions of the wagon in the train and different tappet configurations, a company asked Kot to analyze the stresses acting on the components, the accelerations acting on the wagon, the position of the wagon in the travel cycle based on its geographical coordinates and the speeds of the wagon along the route.
Instrumentation
First, the instrumentation was installed on the railcar, including extensometers, accelerometers, and pressure transducers. In addition, data acquisition was performed continuously during the travel cycles. The project encompassed several couplers, rigid rods, and center beams of a railcar. Figure 1 illustrates the proposed instrumentation diagram.
![Figure 1: Instrumentation diagram. [2]](https://kotengenharia.com.br/wp-content/uploads/2021/10/Kot_Diagrama-de-Instrumenta%C3%A7%C3%A3o.png)
Figure 1: Instrumentation diagram. [2]
Subsequently, the rod was calibrated in the laboratory to determine the relationship between the applied load and the strains measured by the extensometers installed on the rod. To perform the test, a structure was built to secure the rod and hydraulic jacks, which were responsible for applying a known load, as shown in Figure 2. Figure 3 shows some of the installation points for the extensometers on the side of the rod.
![Figure 2: Stem calibration. [2]](https://kotengenharia.com.br/wp-content/uploads/2021/10/Kot_Calibracao-da-haste-1.jpg)
Figure 2: Stem calibration. [2]
![Figure 3: Strain gauge installation points on the side of the rod. [2]](https://kotengenharia.com.br/wp-content/uploads/2021/10/Kot_Pontos-de-instalacao-1.jpg)
Figure 3: Strain gauge installation points on the side of the rod. [2]
Evaluating the operating cycle
Next, the operational cycle was evaluated using the absolute values of the applied loads, the acceleration values at which the highest load amplitudes occurred, and the rainflow method . In other words , the method was used to count the peaks in applied load in order to assess the impacts between railcars. For example, Figures 4, 5, and 6 present some of the results obtained, respectively.
![Figure 4: Dispersion of acting loads. [2]](https://kotengenharia.com.br/wp-content/uploads/2021/10/Kot_ispersao-de-cargas-atuantes-1.png)
Figure 4: Dispersion of acting loads. [2]
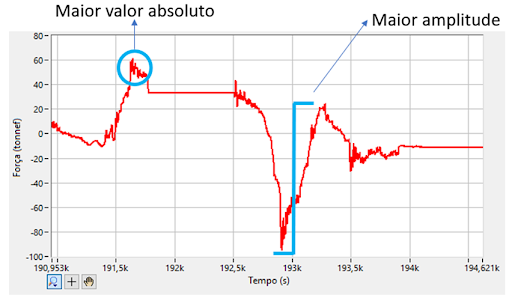
Figure 5: Example of peak amplitude in data collection.
![Figure 6: Example of peaks and attenuation. [2]](https://kotengenharia.com.br/wp-content/uploads/2021/10/Kot_Exemplo-de-picos-e-atenuacao-1.png)
Figure 6: Example of peaks and attenuation. [2]
Fatigue analysis
In addition, the fatigue analysis was performed using the damage accumulation rule with peak counting based on the Rainflow methodology. Each stress peak causes a specific amount of damage according to the material’s fatigue curve, and when the sum of this damage reaches 1, the component fails. Subsequently, the trip cycles were evaluated individually, and the service life was converted into years.
Tape influence assessment
In short, the different coupler configurations are related to the different wheel sizes of the railcars; that is, the railcar under study may have a wheel size larger or smaller than that of the railcar to which it is coupled, and this will cause the coupling assembly to tilt. These differences in coupler configuration can influence the distribution of loads due to the tilt. Consequently, the results of the evaluation are presented in Figure 7.
![Figure 7: Fatigue life according to wagon tape. [2]](https://kotengenharia.com.br/wp-content/uploads/2021/10/Kot_Vida-em-fadiga-1.png)
Figure 7: Fatigue life according to wagon tape. [2]
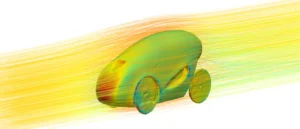
Digital Simulation
In addition, a digital simulation of the drivetrain was also performed. The components were analyzed separately, validated, and calibrated based on data obtained in the field. Figure 8 shows the deformation results for the coupling model.
![Figure 8: Results obtained from the coupling model. [2]](https://kotengenharia.com.br/wp-content/uploads/2021/10/Kot_Resultados-obtidos-no-modelo-do-engate-1.png)
Figure 8: Results obtained from the coupling model. [2]
It can be seen that the head of the coupling, close to the pin region, is a region susceptible to crack nucleation and propagation, a conclusion reached through the simulation and checks carried out by the finite element model.
Recommendations
Finally, upon completion of the analyses, Kot recommended reinforcing the coupling and replacing the material used in it. The new material offers improved fatigue life characteristics, with a minimum increase of more than 200% compared to the previous material.
Conclusion
Thus, in line with the pillars and foundations of Industry 4.0, digital simulations are essential tools for understanding effects that are not visible to the naked eye. This makes it possible to study behaviors, identify areas for improvement, and suggest changes to achieve optimization. Furthermore, theoretical-experimental analyses provide the basis for digital simulations, further enhancing the accuracy of the work.
Kot can be your partner in matters related to Industry 4.0, helping you to understand real and complex engineering possibilities and contexts. Contact our team for more information!
Follow our pages on LinkedIn, Facebook e Instagram to keep up with our content.
References:
[1] All about digital simulation, one of the main pillars of industry 4.0, SENAI [S.I]. Available at: https://www.senairs.org.br/industria-inteligente/tudo-sobre-simulacao-digital-um-dos-principais-pilares-da-industria-40
[2] Kot Engenharia Collection.