Introduction
Crushing is a set of operations carried out to fragment blocks of ore of various sizes, and can be segmented into stages, such as primary and secondary. The machines most commonly used during crushing are crushers, which come in different types, such as gyratory, jaw, impact and roller crushers.
In this regard, this article discusses one of Kot’s success stories, in which a failure analysis was conducted on the driven shaft of a roller crusher (Figure 1 shows the fractured shaft). Furthermore, the system in question consists of a set of 9 rotors, each comprising three teeth, and the shaft, in turn, is driven by an electric motor system connected to a hydrodynamic coupling.
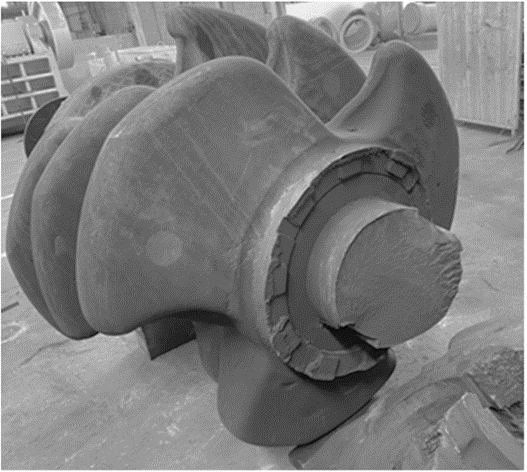
Figure 1: Fractured crusher shaft.
In order to determine the causes of the failure, Kot carried out a structural assessment of the axle, using visual inspections, laboratory analysis and computer analysis using the Finite Element Method (FEM).
Methodology used
The activity began with the as-built model of the crusher shaft, using a 3D scan of the fractured structure, as well as a dimensional survey. The scanned shaft model can be seen in Figure 2.
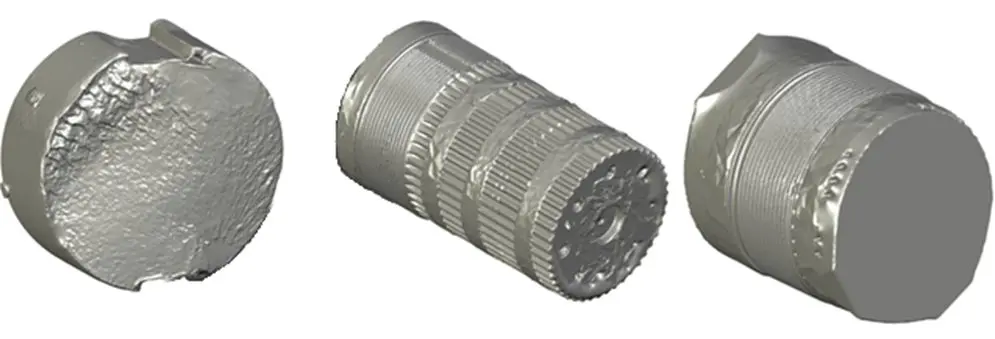
Figure 2: 3D scan of the fractured shaft. SOURCE: Kot Collection.
Next, the finite element model was generated using specialized software. For mesh generation, a combination of second-order tetrahedral and hexahedral solid elements was used. In this context, the failure region of the shaft was modeled with a finer mesh, with the aim of achieving a better balance between computational cost and accuracy for the calculation of the stress field. Figure 3 shows the finite element model.
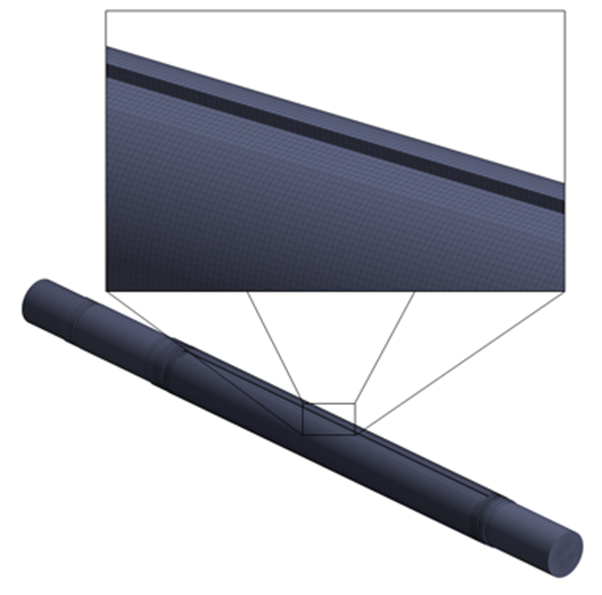
Figure 3: Finite element model of the crusher shaft. SOURCE: Kot Collection.
Similarly, just as the correct discretization of the continuous medium is crucial, the application of boundary conditions is also essential for obtaining results that accurately reflect the reality of the simulated object, especially in a failure analysis. To this end, constraints were applied to the model to represent the contact between the shaft and the radial bearings, as well as the contact between the splined section and the drive system’s gearbox. The loads generated at the contact between the teeth and the material to be crushed were applied as remote loads to account for bending and torsional moments.
In addition, various operating conditions were simulated in order to cover the widest range of stresses acting on the shaft during one rotation, as well as to account for the various load cycles to which the equipment is exposed over its service life. Thus, the variation in tooth positions and load magnitudes considered allows for a fatigue analysis with a load spectrum that most closely approximates reality. Figure 4 illustrates the boundary conditions for one of the simulated operating scenarios.
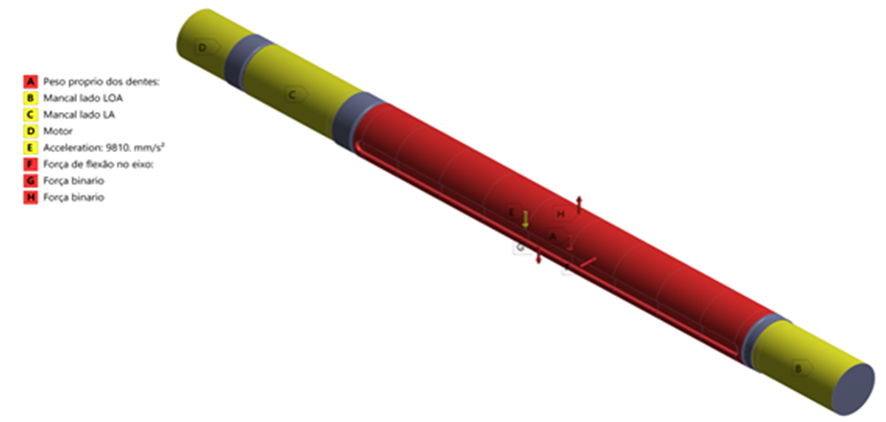
Figure 4: Boundary conditions and loads applied to the computer model. SOURCE: Kot Collection.
Results
After the computational model was developed, static analyses were performed using the finite element method. In general, for all cases, including the maximum torque (see Figure 5), the shaft structure exhibits a safety factor greater than that considered adequate for this type of application, indicating that the structure can withstand the applied static forces.
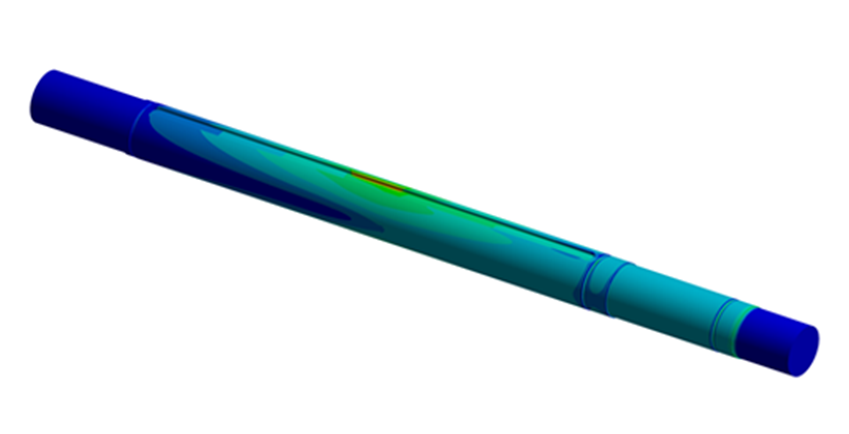
Figure 5: Results of the static analysis using the finite element method. SOURCE: Kot Collection.
Subsequently, the second stage of the failure analysis involved assessing shaft fatigue. Based on the motor current history recorded by the automation system, the load cycles were counted using the Rainflow methodology, as recommended by international standards.
In this scenario, due to the crusher’s operating mode, a non-reversible multiaxial stress state is generated, requiring the use of a specific fatigue analysis methodology. The classic S-N diagram indicates a constant plateau after106 cycles; however, according to an international standard, steels in components subjected to a high number of cycles do not exhibit such a plateau. Consequently, the slope of the S-N curve was adjusted after106 cycles to reflect this behavior, as shown in Figure 7. Based on the S-N curve and the number of cycles to which the shaft was subjected prior to failure, a safety factor higher than the recommended value was also obtained, indicating that fatigue failure of the shaft was not expected.
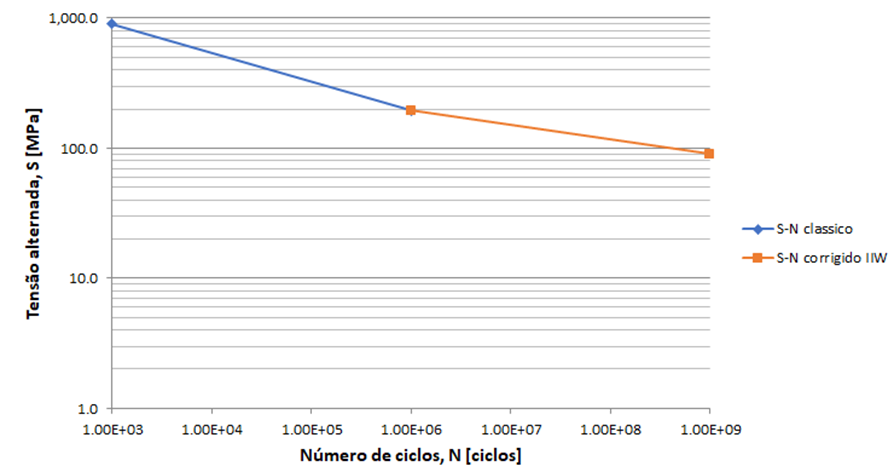
Figure 7: S-N diagram for the crusher shaft. SOURCE: Kot Collection.
In order to better understand the cause of the failure, a detailed analysis of the fracture surface was conducted, which confirmed the presence of several cracks near the keyway, resulting from previous maintenance work performed on the shaft. The coalescence of these cracks formed a macro-crack, which propagated due to fatigue and compromised a portion of the shaft’s cross-section prior to failure. Given this, the possibility of failure due to overload during operation was raised.
In order to understand the magnitude of the load that caused the failure, an elastic linear fracture mechanics analysis was performed, in which a crack with dimensions similar to those observed on the fracture surface was incorporated into a finite element computational model. This allows for the calculation of the Stress Intensity Factor (SIF) at the crack tip and comparison of this parameter with the material’s Fracture Toughness (KIC).
Thus, based on the simulations performed, it was observed that stresses equivalent to the maximum torque of the drive motor were capable of causing the combined FIT for the tensile and torsional modes to equal the material’sKIC, resulting in shaft fracture. Figure 8 illustrates the distribution of the Stress Intensity Factor at the tip of the crack incorporated into the computational model.
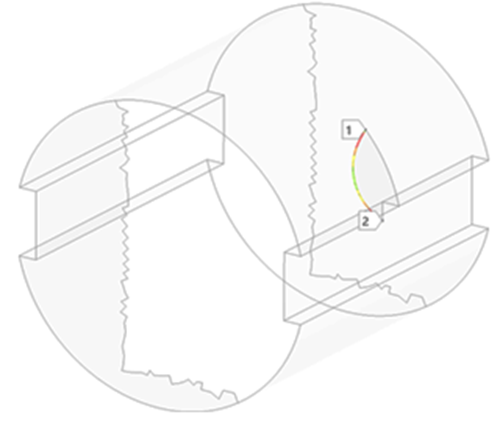
Figure 8: Stress Intensity Factor obtained from the computer model. SOURCE: Kot Collection.
Conclusion
In summary, based on the analyses conducted, it can be concluded that the shaft design was adequate for the applied stresses. However, due to defects resulting from maintenance work on the shaft, a crack formed and propagated steadily due to fatigue until, during an overload event, the material reached its fracture toughness, resulting in the brittle fracture of the shaft.
The Kot team has a team of qualified Structural Integrity professionals to develop the best engineering solutions for our clients' assets. Contact our team for more information!
Follow our pages on LinkedIn, Facebook e Instagram to keep up with our content.
FAQ
1. O dimensionamento original do eixo era adequado para as cargas de operação do britador?
Sim, as simulações computacionais estáticas e de fadiga demonstraram que o projeto do eixo era perfeitamente adequado para os esforços nominais de trabalho. Mesmo considerando os picos de torque do motor e o histórico de corrente registrado pela automação através da contagem de ciclos Rainflow, os fatores de segurança calculados permaneceram acima dos limites recomendados por normas internacionais. Isso comprovou que a ruptura não foi causada por erro de cálculo de projeto nem por subdimensionamento mecânico.
2. Quais foram as principais etapas metodológicas empregadas no diagnóstico da falha?
A investigação da causa raiz seguiu uma sequência técnica rigorosa para reconstruir a história da fratura:
-
Levantamento As-Built por Escaneamento 3D: Captura precisa da geometria do eixo fraturado para geração de modelo tridimensional fiel à peça real;
-
Modelagem por Elementos Finitos (MEF): Discretização com malha refinada na região de falha, simulação do contato nos mancais e aplicação de cargas remotas nos dentes;
-
Análise Fractográfica e Mecânica da Fratura (LEFM): Inspeção visual da superfície de ruptura e introdução de trinca virtual no modelo computacional para determinar o Fator de Intensidade de Tensões (FIT).
3. Qual foi a causa raiz real que desencadeou a fratura catastrófica do eixo?
A falha teve origem em microtrincas geradas por intervenções prévias de manutenção nas proximidades do rasgo de chaveta. Com o trabalho contínuo do britador, essas trincas coalesceram em uma macrotrinca que se propagou de forma estável por fadiga, reduzindo gradualmente a seção resistente do metal. O colapso final ocorreu quando um evento de sobrecarga operacional elevou o Fator de Intensidade de Tensões ao limite da Tenacidade à Fratura (Kic) do material, provocando a ruptura frágil e repentina do componente.
4. Como a Mecânica da Fratura Linear Elástica (LEFM) comprovou o momento do colapso?
A aplicação da LEFM permitiu simular a interação entre o defeito físico existente e as tensões operacionais máximas:
-
Inserção do Defeito no Modelo: Uma trinca com dimensões equivalentes às observadas na superfície de fratura real foi modelada na região do rasgo de chaveta;
-
Cálculo do FIT Combinado: O modelo determinou o Fator de Intensidade de Tensões resultante da combinação dos modos de tração e torção atuantes;
-
Comparação com a Tenacidade (Kic): Constatou-se que surtos de carga equivalentes ao torque máximo do motor faziam o FIT atingir o limite crítico do material, disparando a fratura instantânea.