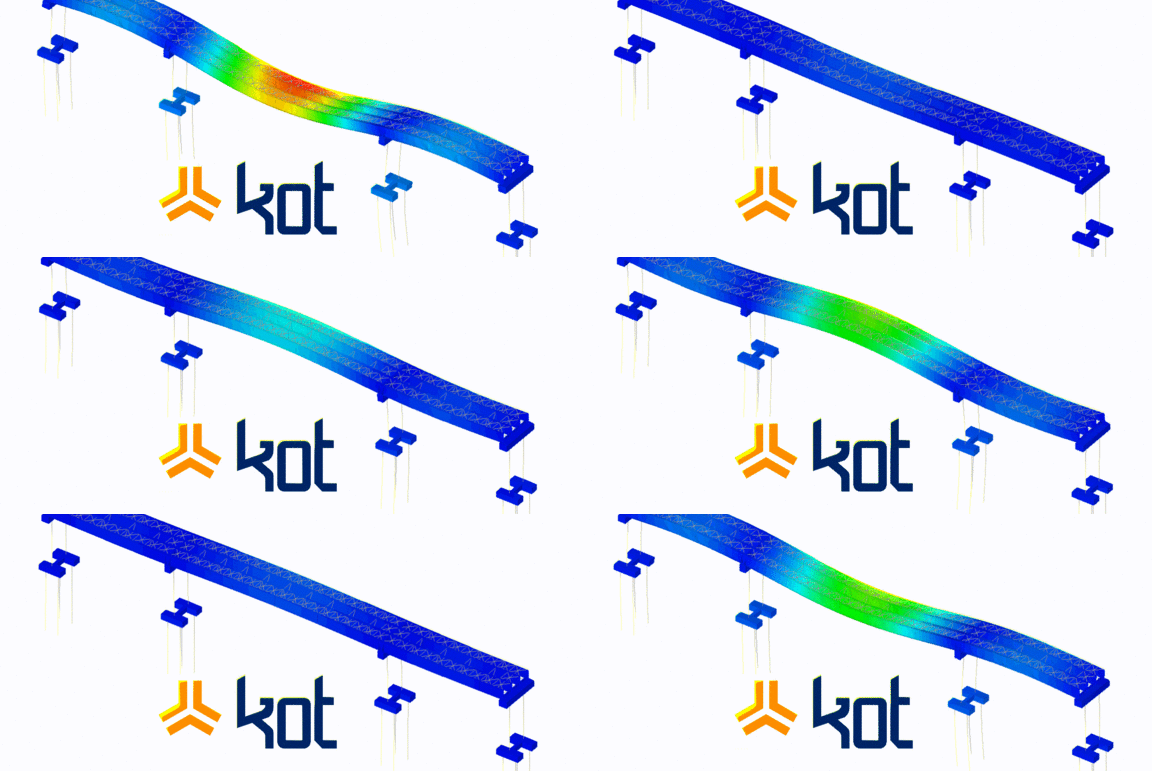
O Operating Deflection Shape (ODS) é uma metodologia avançada de análise de vibração que mapeia a deflexão (forma de deformação) de uma estrutura ou equipamento enquanto ele está operando sob suas cargas reais. Por meio da coleta de dados com acelerômetros e do processamento matemático (FFT), o ODS converte a vibração global percebida no equipamento em diagnósticos visuais e quantitativos. Ele é essencial para identificar a causa raiz de falhas complexas, como ressonância, desbalanceamento, desalinhamentos e problemas de fundação que ameaçam a integridade estrutural do ativo.
Descubra como o ODS pode diagnosticar falhas dinâmicas e evitar o colapso de estruturas industriais.
What is ODS and how can it be used to solve structural non-conformities?
In general, the main objective of vibration analysis is to guarantee the availability for operation, safety and Structural Integrity a component, piece of equipment or structure. Equipment in operation generates vibrations, and even if it is at rest (out of operation), it can vibrate because it is excited by an external force (by a wind load, for example).
On a day-to-day basis in the field, vibrational analysis is carried out by collecting the vibrations that this equipment is subjected to. This is done using accelerometers. These accelerometers vibrate and, as they vibrate, generate low-current electrical signals that are read by a data acquisition system. This data is processed using specific algorithms, making it possible to analyze the vibration.
Currently, this vibration analysis can be performed online (with accelerometers mounted directly and permanently on the object) or offline, with the engineer collecting this data in the field.
In this regard, using data processed by algorithms, those involved in the process seek to detect failures early on or investigate the causes of known failures. Among the most common problems—which can cause issues due to vibration—encountered in the field during the company’s day-to-day operations, the following stand out: cavitation in pumps; electric motor failures; gearbox failures; imbalance, bearing failures, misalignment, and resonance; among other issues.
In this context, the Operating Deflection Shape (ODS) is a methodology used in day-to-day vibration analysis. To understand it, it is important to review a few academic concepts:
Degree of Freedom (GDL):
As determined by RAO (2009), for vibration analysis, the most simplified system is the model with a GDL, whose movement is determined by a specific coordinate or variable. Thus, the GDL is a certain minimum number of coordinate points for determining the positioning and movement of this system.
Free vibration:
Free vibration is characterized when a given object undergoes an initial disturbance and, after this moment, it continues to vibrate on its own, without the action of any external force causing additional vibrations in the system. The classic example of free vibration is a simple pendulum. Once it has moved to its starting point and is released, it begins to oscillate without any external forces acting on it.
Forced vibration:
Forced vibration differs from free vibration in that external forces act on the system under study. The classic example of forced vibration is a rocking chair which, after an initial disturbance, needs a continuous disturbance for the oscillatory movement of the child on the swing to continue.
In practice, in day-to-day industrial operations, imbalances in rotating components such as pulleys, flywheels, fans, etc., are common examples. In practice, forced vibration can be caused by factors such as: failure of a specific component that can excite the structure at a different frequency (failure of a gear tooth in a gearbox, for example); inadequate structural design; structural misalignments exceeding design specifications; unanticipated external and/or environmental excitations; mass imbalance during component manufacturing (unbalanced masses in pulleys, drums, flywheels, fans, etc.).
Natural frequency:
In general, the natural frequency is the characteristic frequency—or specific set of frequencies—of a given object in free vibration. This frequency is determined by factors such as geometry, mass, dimensions, and the materials used in the construction of the object under study. For simple objects, a relatively easy way to obtain the natural frequencies is to excite the object and then allow it to vibrate freely, with gravity being the only external force. In this way, the natural frequency can be measured using appropriate instrumentation.
Modal analysis:
In this regard, for complex equipment and structures (yard machinery, conveyors, and metal structures, etc.), a modal analysis must be performed to determine the structure’s natural frequencies. For this assessment, parameters such as the stiffness and mass of the object under study are utilized. Modal analysis is a very important tool for ensuring the Structural Integrity an asset, whether during its design or during its operation. Based on this, once the natural frequencies of the object are known, its excitation sources must then be investigated. Examples of these sources include motors, gearboxes, screens, and rotating equipment in general that interface with the system. Thus, the occurrence of resonance can be prevented. GIF 1 shows a modal analysis performed by Kot.
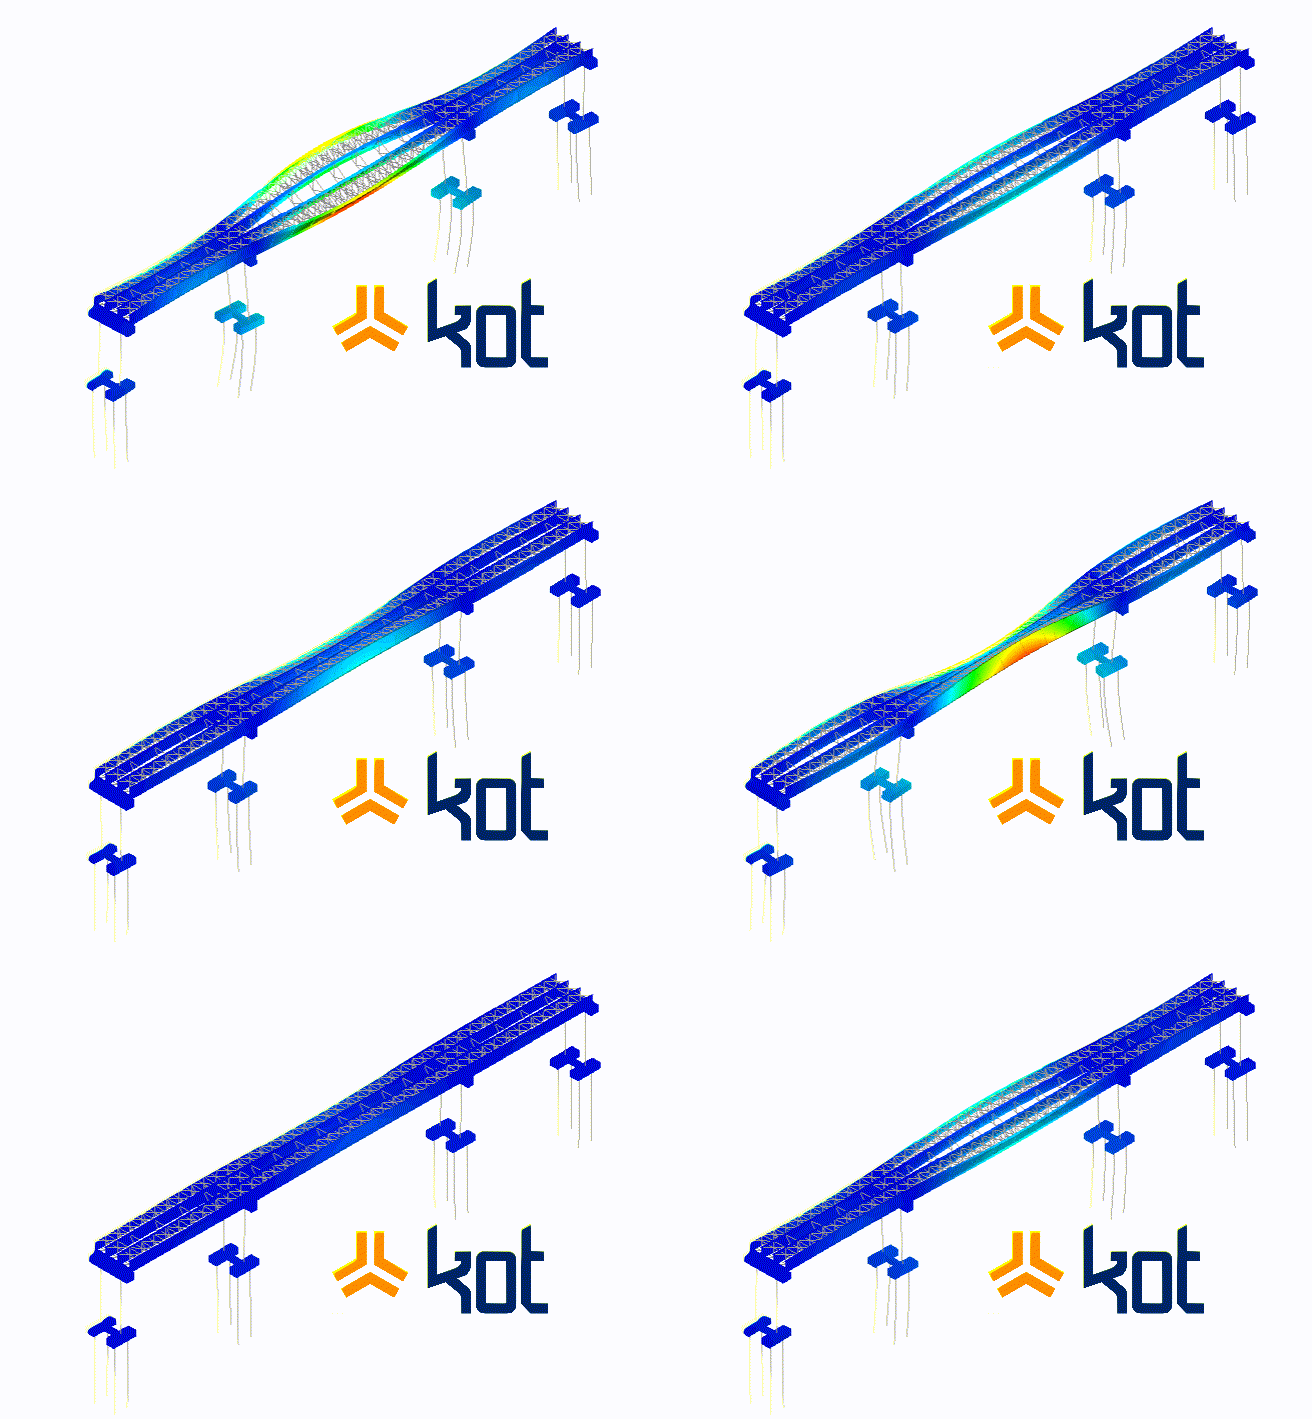
Gif 1: Modal analysis on a bridge - Source: Kot Collection.
It is important to note that this analysis gives the modal response of the object, in which each natural frequency is associated with a mode, a way of vibrating(shape). For field analysis of a system with several sources of excitation, ODS analysis is indicated and can work in conjunction with modal analysis, especially in cases where there is an overlap of frequencies. In these cases, resonance in multiple structural modes is possible.
MRI
In this context, resonance occurs when the frequencies of the excitation sources in the equipment, structure, or nearby areas are close to or equal to the natural frequencies of the system under study. When this occurs, if the system is not damped, the object under study or analysis may exhibit large displacements that were often not considered in the equipment’s design. Such displacements can cause phenomena such as low-cycle fatigue, reduced component life, and even structural collapse of the object. GIF 2 shows the well-known case of the Tacoma Narrow Bridge in resonance with wind loads.

Gif 2: Tacoma Narrow Bridge in resonance - Source: https://tenor.com/view/tacoma-narrows-bridge-shaking-earthquake-gif-17537817
Mastery of time
To make it easier to understand, vibration in the time domain can be interpreted as the sum of all the vibrational contributions that the equipment experiences over time. Thus, the sum of these contributions for each piece of equipment can be perceived, and in practice corresponds to the vibration that the human body feels when standing on a vibrating object. For example, when standing on a conveyor belt, it is the vibration that the worker perceives on the walkway. It is the sum of the vibrations from the motor, gearbox, drums, belt, rollers, wind load, and so on, interacting with one another.
Frequency domain
On the other hand, when the frequency domain is analyzed, it is possible to isolate the contribution of each vibration component to the object. To clarify this concept, MASTRIANI (2018) presents a comparison between the time domain and the frequency domain in Figure 1. On the left side, one can see the vibration of two components acting on the object and the resulting vibration, which represents the analysis in the time domain. On the right side of the figure, one can analyze the separate contribution of the two components, which constitutes the analysis in the frequency domain. Thus, on the left side, the amplitude of the signal in the time domain is visible, and on the right side, the amplitude of the signal in the frequency domain.
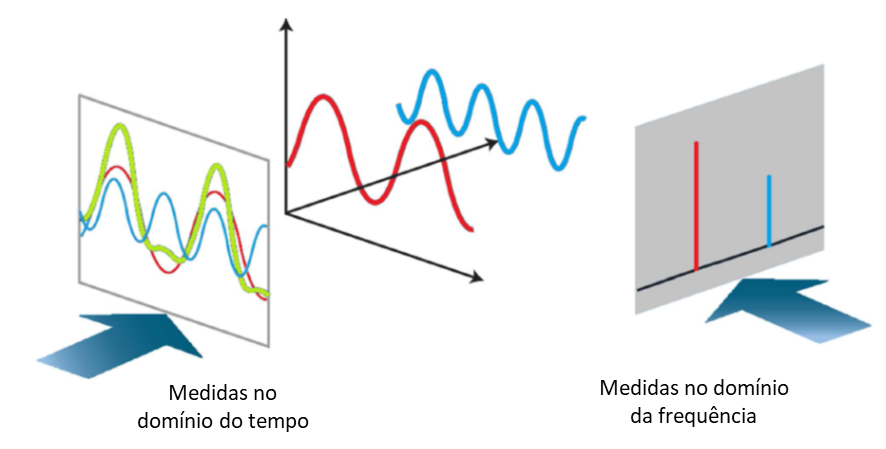
Figure 1: Vibration analysis in the time domain and frequency domain - Source: MASTRIANI (2018)
Fast Fourier Transform (FFT)
In this sense, the FFT is a mathematical tool used to discretize vibrations from the time domain to the frequency domain. In practice, an algorithm is developed to perform this transform for processing the collected data, or a specific commercial software program is used to perform this data processing.
SDGS
As defined by DOSSING (1988), ODS (Operating Deflection Shape) can be measured on a given object directly, by relatively simple means. This methodology provides very useful information for understanding and evaluating the dynamic behavior of a component, piece of equipment or structure.
RICHARDSON (1997), has the following definitions for ODS:
-
- ODS is defined as the deflection of an object (structure, component or equipment) at a specific frequency. More generally, the methodology can be defined as any forced movement of two or more points on an object. In this context, when movement is determined from two or more coordinates, a deflection shape is defined;
-
- A shape is the movement of a coordinated point in relation to all the others. In this context, movement constitutes a vector quantity, having location and directions associated with it. This vector quantity is also known as an important concept in the study of vibrations known as GDL;
-
- The ODS can be defined and determined from a specific displacement of a forced vibration, either at a specific time or at a specific frequency. In this way, the ODS can be obtained for various types of responses in the time domain, whether these responses are sinusoidal, punctual or completely random.
So, in practice, how can ODS contribute to the Structural Integrity your asset? Kot suggests the following steps to take when a client encounters a new issue that compromises human comfort and/or could cause damage to their asset:
-
- Based on the client's account of their asset, drawings (structural, civil and/or mechanical) are used to study the entire system involved, as well as the battery limits for defining the model. In this study, possible frequency ranges and excitation sources are surveyed in order to plan the solution. It is important at this stage that the engineer has clear knowledge of the equipment's history and operating conditions, especially when the unwanted vibration phenomenon occurs;
-
- Whether or not modal analysis is necessary for investigating the phenomenon is defined;
-
- Based on the previous study, the accelerometers to be used are defined, as well as the available electronics with the compatible number of channels. Collection points are also defined and any deviations that may occur during the tests are identified for mitigation;
-
- Data is collected in the field with specialized electronics to meet the demand. The equipment must be in the condition in which the inconvenient vibration phenomenon occurs, so that the model reproduces reality. Other frequency and operating ranges can be explored in order to detect other future hidden non-conformities;
-
- Once back in the field, using specific mathematical tools, the data is processed and analyzed. The information obtained in the pre-study is compared with the data collected in order to diagnose the phenomenon. In this confrontation, various questions are asked, such as: what directions and displacements the asset makes; what is the behavior of the structure when excited; what are the differences in displacement between the various points of the asset; which sources of excitation contribute most to the perceived phenomenon, among others;
-
- Based on the data studied and analyzed, a report is presented with the diagnosis obtained, as well as the actions required to resolve the problem.
Conclusion
Finally, if you need ODS and vibration analysis solutions to ensure the Structural Integrity your asset, please contact us. Kot has qualified professionals and specialized equipment available to help you find the right solution for your asset. Contact our team for more information!
Follow our pages on LinkedIn, Facebook e Instagram to keep up with our content.
FAQ
1. O que significa ODS (Operating Deflection Shape) na prática?
ODS, ou Forma de Deflexão Operacional, é o mapeamento do movimento forçado de dois ou mais pontos de uma estrutura operando em sua condição real. Em termos práticos, é a medição vetorial (com direção, sentido e amplitude) de como um equipamento “se contorce” ou se desloca em uma frequência específica durante o seu funcionamento normal, permitindo visualizar onde o estresse dinâmico está concentrado.
2. Qual é a diferença entre Análise Modal e Análise ODS?
Embora sejam complementares, elas têm objetivos distintos:
-
Análise Modal: Identifica as frequências naturais inerentes à estrutura e seus modos de vibrar, baseando-se em sua massa e rigidez, independentemente das forças de operação. É muito usada na fase de projeto para evitar ressonâncias.
-
Análise ODS: Mede como a estrutura vibra na vida real, sob a influência de todas as fontes de excitação externas e operacionais combinadas (motores, correias, impactos). É ideal para equipamentos em campo que sofrem com múltiplas fontes de vibração simultâneas.
3. O que é ressonância estrutural e quais os seus riscos para a indústria?
A ressonância ocorre quando a frequência de uma força de excitação externa (como a rotação de um motor ou a passagem de uma correia) se iguala a uma das frequências naturais da estrutura. Quando isso acontece, a estrutura absorve essa energia e passa a apresentar deslocamentos e vibrações extremamente elevados, que não foram previstos no projeto. Isso pode causar fadiga acelerada, quebra prematura de componentes mecânicos e até o colapso estrutural total (como o famoso caso da ponte Tacoma Narrows).
4. Qual a diferença entre vibração livre e vibração forçada?
-
Vibração Livre: Ocorre quando um sistema recebe um impacto ou perturbação inicial e continua vibrando sozinho, sem forças externas contínuas (exemplo: um pêndulo oscilando até parar).
-
Vibração Forçada: Ocorre quando uma força externa contínua excita o sistema (exemplo: uma criança sendo empurrada constantemente em um balanço). Na indústria, o desbalanceamento de um ventilador ou a quebra do dente de uma engrenagem são fontes constantes de vibração forçada.
5. Como funciona a análise de vibração no “domínio do tempo” versus “domínio da frequência”?
-
Domínio do Tempo: Mostra a vibração global exata que o equipamento (ou uma pessoa sobre ele) está sentindo naquele momento. É a soma caótica de todas as vibrações acontecendo juntas.
-
Domínio da Frequência: Separa esse sinal caótico, permitindo ver a contribuição individual de cada componente (o que é culpa do motor, o que é culpa do redutor, etc.), facilitando a identificação da peça defeituosa.
6. O que é a Transformada Rápida de Fourier (FFT) na análise de dados?
A FFT (Fast Fourier Transform) é o algoritmo matemático utilizado pelos hardwares e softwares de aquisição de dados para converter o sinal complexo coletado no “domínio do tempo” e separá-lo em gráficos claros no “domínio da frequência”. Sem a FFT, seria praticamente impossível isolar a causa raiz de um problema vibracional em um sistema complexo.
7. Quais falhas mecânicas e estruturais mais comuns o ODS ajuda a diagnosticar?
A aplicação conjunta de acelerometria e algoritmos de ODS permite detectar prematuramente:
-
Cavitação em sistemas de bombeamento;
-
Desbalanceamento de massas (em polias, tambores e volantes);
-
Desalinhamentos excessivos de eixos e estruturas;
-
Folgas mecânicas e falhas em rolamentos;
-
Deficiência na rigidez de bases e fundações.
8. Quais são os passos para realizar uma análise de ODS em campo?
Para um diagnóstico efetivo e seguro, a investigação geralmente segue uma metodologia rigorosa:
-
Estudo Prévio: Análise de desenhos técnicos (mecânicos e civis) e entendimento do histórico de falhas relatado pela operação;
-
Planejamento: Definição da necessidade de análise modal complementar e seleção dos acelerômetros e pontos de coleta;
-
Coleta de Dados: Medição em campo com o equipamento rodando exatamente na condição operacional que gera o problema (ex: moinho carregado, velocidade máxima);
-
Tratamento e FFT: Processamento matemático dos sinais e cruzamento das fontes de excitação com as deflexões medidas;
-
Diagnóstico: Emissão de relatório indicando a causa raiz e as modificações estruturais ou mecânicas necessárias para eliminar a não conformidade.
References:
[1] MASTRIANI, Mario. Quantum-classical algorithm for an instantaneous spectral analysis of signals: a complement to Fourier Theory. 2018;
[2] RAO, Singiresu S. Vibrações mecânicas. Pearson Education, 2009;
[3] DOSSING, Ole. Structural stroboscopy-measurement of operational deflection shapes. Sound and Vibration Magazine, v. 1, p. 18-24, 1988;
[4] RICHARDSON, Mark H. et al. Is it a mode shape, or an operating deflection shape?.Sound and Vibration, v. 31, n. 1, p. 54-67, 1997.