Introduction
Firstly, structural failures in industrial equipment are not always associated with excessive loads or extreme events. In many cases, metal structures fail after long periods of operation under stresses below the material's yield strength, without showing visible signs of prior deterioration. This type of failure is directly related to the phenomenon of fatigue, and fracture mechanics applied to Structural Integrity is Structural Integrity fundamental approach to understanding and evaluating these mechanisms.
Fatigue is one of the main failure mechanisms in structures subjected to cyclic loading, as occurs in mining equipment, bulk handling systems, ports, and industrial plants in general. In contrast to static overload failures, fatigue develops progressively and silently over time, and can culminate in sudden fractures with high operational impact, often without any noticeable warning. Figure 1 illustrates the collapse of a bucket wheel excavator due to a fatigue crack in one of the tie rods.
![Figure 1 – Collapse of a bucket wheel excavator due to fatigue failure of one of the tie rods (Taken from Rusiński et al. [1]).](https://kotengenharia.com.br/wp-content/uploads/2026/02/fig1.jpg.webp)
Figure 1 – Collapse of a bucket wheel excavator due to fatigue failure of one of the tie rods (Taken from Rusiński et al. [1]).
Currently, among the methodologies available in the literature for evaluating the fatigue life of a structural component, the most notable are stress-controlled fatigue (S-N method), strain-controlled fatigue (ε-N method), and Linear Elastic Fracture Mechanics (LEFM).
A priori, Fracture Mechanics assumes that defects in a structure are inevitable and may be linked to the manufacturing process. Thus, even if the structure has never been put into operation, its fatigue life may be compromised, since the nucleation stage of a possible crack has already occurred, leaving only the propagation stage.
Therefore, Linear Elastic Fracture Mechanics has established itself as an essential tool for assessing Structural Integrity, especially when defects such as cracks and corroded areas are present in components. This article presents the fundamental concepts of Fracture Mechanics, illustrated by real-world practical applications in industrial structures analyzed by Kot Engenharia.
Concepts and definitions
There are three classic modes of crack propagation, characterized by the relative displacement between the crack faces and the type of stress associated with it. Mode I corresponds to the opening of the crack by traction, Mode II is related to the sliding of the faces by shearing in the plane of the crack, while Mode III refers to the tearing of the component due to the action of out-of-plane shear stresses (torsion, for example). Figure 2 illustrates these modes of propagation.
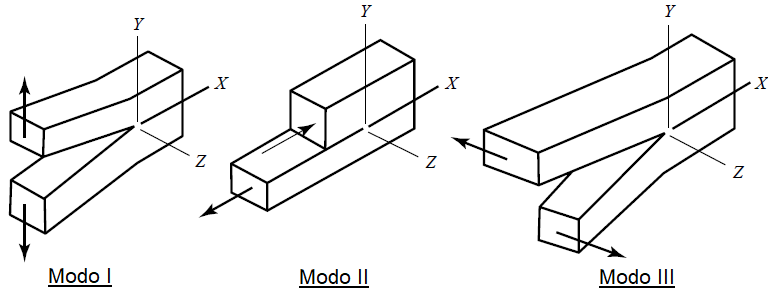
Figure 2 – Crack propagation modes.
In this sense, in Linear Elastic Fracture Mechanics, the Stress Intensity Factor (K) is the parameter used to determine the distribution of stresses around the crack tip, allowing its behavior to be evaluated during the propagation stage. The calculation of this parameter is usually performed analytically, using the formulations available in the literature and in standards such as BS 7910 [2] and API-579 [3], but it can also be obtained using computational tools. In addition, the advantage of the latter method is the possibility of analyzing crack propagation in complex geometries, for which there are no theoretical formulations that are perfectly compatible with the geometry under study. Figure 3 shows the computational modeling of a semi-elliptical crack in a plate.
![Figure 3 – Computational modeling of a semi-elliptical crack (Taken from Anderson [4]).](https://kotengenharia.com.br/wp-content/uploads/2026/02/fig3.png.webp)
Figure 3 – Computational modeling of a semi-elliptical crack (Taken from Anderson [4]).
In general, crack growth occurs steadily during most of the fatigue life (stage II), as illustrated in the crack propagation stage graph shown in Figure 4. For stage II, the crack growth rate (da/dN) can be well represented by the curve fit proposed by engineer and professor Paul C. Paris in the early 1960s, giving rise toParis's Law. Finally, in the final phase (stage III), accelerated and unstable crack growth occurs, leading to catastrophic failure of the structure. At this point, the stress intensity factor equals the fracture toughness (KIC) of the material.
![Figure 4 – Stages of crack propagation (Adapted from Lee et al. [5]).](https://kotengenharia.com.br/wp-content/uploads/2026/02/fig4.png.webp)
Figure 4 – Stages of crack propagation (Adapted from Lee et al. [ 5]).
Therefore, once the crack growth rate has been calculated, it is possible to determine the time for the crack to propagate until it reaches instability and, consequently, to evaluate the fatigue life based on Fracture Mechanics. To do this, it is necessary to perform the integration process of the inverse of the crack growth rate, starting from an initial crack size to the final size. Numerical integration methods, such as Simpson's Rule (see application in Figure 5), can be used.
![Figure 5 – Calculation of crack propagation time using Simpson's Rule (Taken from Dowling [6]).](https://kotengenharia.com.br/wp-content/uploads/2026/02/fig5.png.webp)
Figure 5 – Calculation of crack propagation time using Simpson's Rule (Taken from Dowling [6]).
Fracture mechanics as a predictive maintenance tool
The integration of Linear Elastic Fracture Mechanics with predictive maintenance strategies is aligned with the design philosophy known as fail safe. In this approach, defects are accepted, provided that the structure is capable of operating safely until the damage is detected and properly repaired.
Thus, by estimating the time required for a crack to grow to the point where it behaves in an unstable manner, it becomes possible to define more efficient inspection intervals, prioritize interventions at critical points, reduce unexpected downtime, and, consequently, increase the reliability and availability of industrial assets.
This methodology therefore allows for Structural Integrity management Structural Integrity on technical data and the actual behavior of the structure, replacing purely empirical criteria.
Several inspection techniques can be used to detect cracks in structures, ranging from simple visual inspection to more advanced techniques such as ultrasound and X-rays. However, when assessing the Structural Integrity equipment, it should be borne in mind that the inspection technique to be adopted will define the minimum detectable crack size (ad). Assuming that a structure may contain a crack of this magnitude, it may propagate until its critical length (ac) is reached.
When a crack is detected and repaired, a final inspection must be performed to certify that no cracks remain in the structure, in which case it is assumed that Structural Integrity restored. The larger the crack, the greater the chances of detecting it. However, in reality, it is known that there is no guarantee that 100% of cracks have been eliminated, given that there is a minimum detectable size associated with the inspection method employed. For this reason, it is essential to carry out periodic inspections so that the probability of detection is maximized and the risks of structural failure are minimized. The relationship between crack growth and periodic inspections can be better visualized in Figure 6.
![Figure 6 – Relationship between crack growth and periodic inspections (Adapted from Dowling [6]).](https://kotengenharia.com.br/wp-content/uploads/2026/02/fig6.png.webp)
Figure 6 – Relationship between crack growth and periodic inspections (Adapted from Dowling [6]).
Practical applications: examples of structures analyzed by Kot Engenharia
Axis of a crusher
Kot analyzed a failure that occurred in the shaft of a crusher. The equipment in question underwent a change in the material handled and began crushing a mineral with a higher hardness than in the previous operation. Figure 7 shows the breakage of the shaft in question.
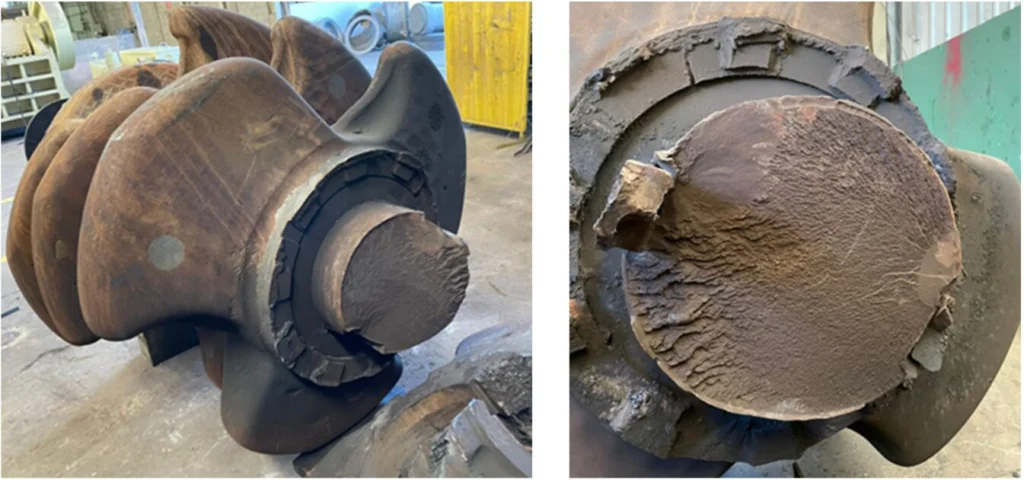
Figure 7 – Breakage of the crusher shaft.
During the failure analysis, a finite element model was developed using specific software, as illustrated in Figure 8. In addition, the following steps were performed:
- Visual inspection of the axle structure after breakage;
- Laboratory analysis of the mechanical properties of the shaft;
- Static analysis using the finite element method;
- Multiaxial fatigue analysis using the S-N method;
- Evaluation of shaft strength considering the weakened section due to the presence of a crack.
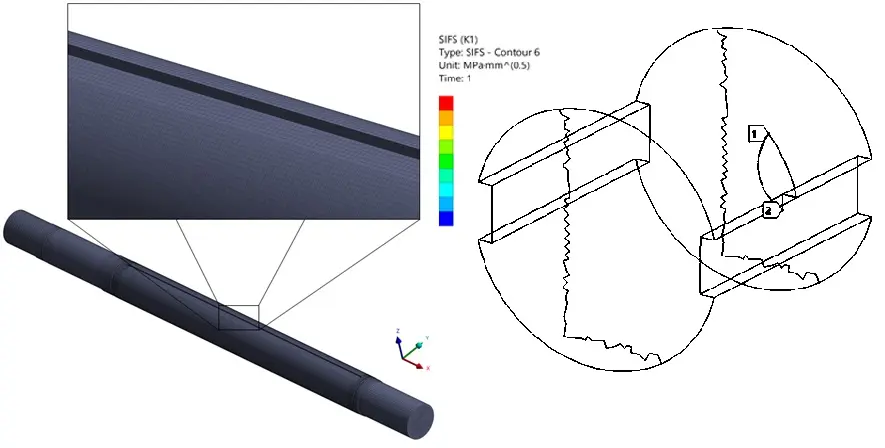
Figure 8 – Finite element model of the crusher shaft.
In conclusion, after the investigation was completed, it was possible to conclude that the shaft failure was caused by a combination of two factors: overload resulting from the fall of non-crushable material onto the equipment and weakened shaft integrity due to the existence of a crack on its surface, near the keyway. The fracture surface of the shaft can be seen in Figure 9.
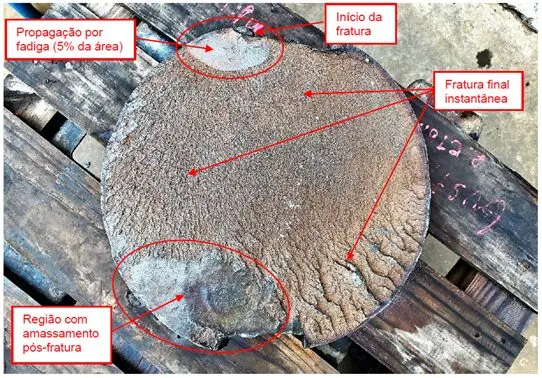
Figure 9 – Fracture surface of the crusher shaft.
Fracture mechanics analysis in recovery equipment
Kot Engenharia a fracture mechanics analysis of the lower pin of the mast of a bucket wheel reclaimer. The client company, through ultrasound inspection, detected similar cracks in the pins on the left and right sides of the machine. The identification of the pins can be seen in Figure 10.
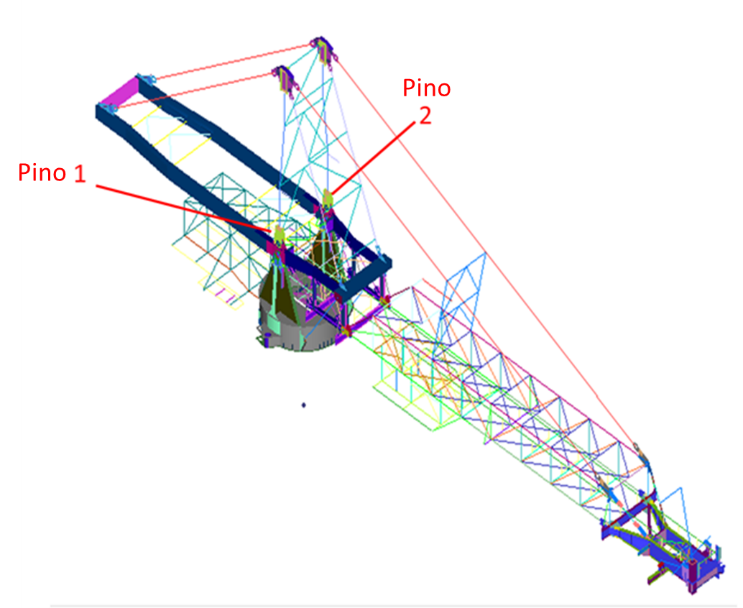
Figure 10 – Identification of the pins evaluated in the recovery machine.
Due to the inspection, it was necessary to assess the growth rate of the crack already present in the pins in order to estimate the remaining life of the component. To this end, Kot modeled the pins in finite elements to calculate the acting stresses (see Figure 11).
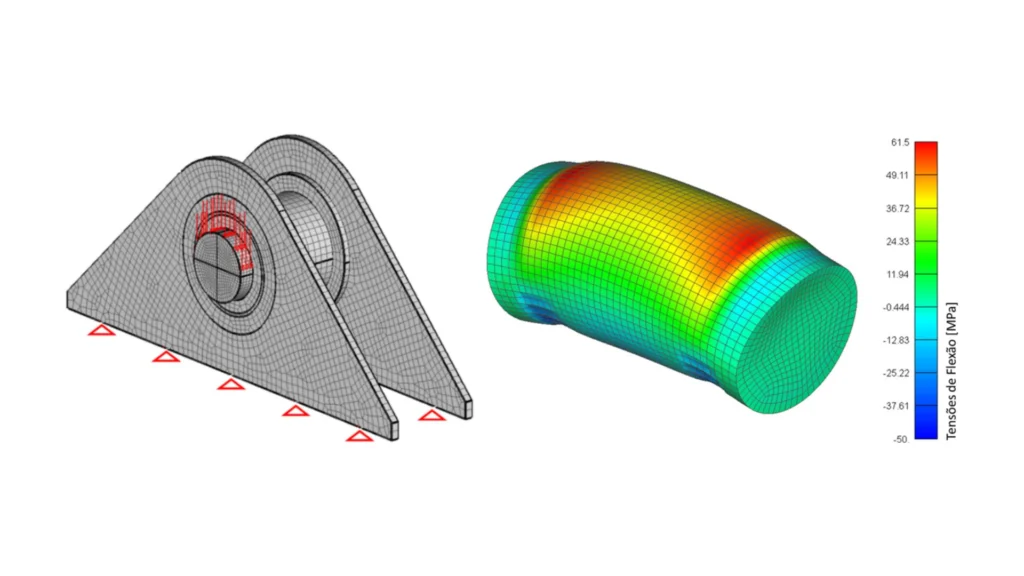
Figure 11 – Computational model used in the analyses.
In the fracture mechanics analysis, the variation in crack depth was evaluated as a function of the number of cycles, as illustrated in Figure 12. Thus, based on the results obtained in the analysis, it was possible to predict how long it would take for the cracks to reach critical size. From this, Kot suggested actions for monitoring the asset.
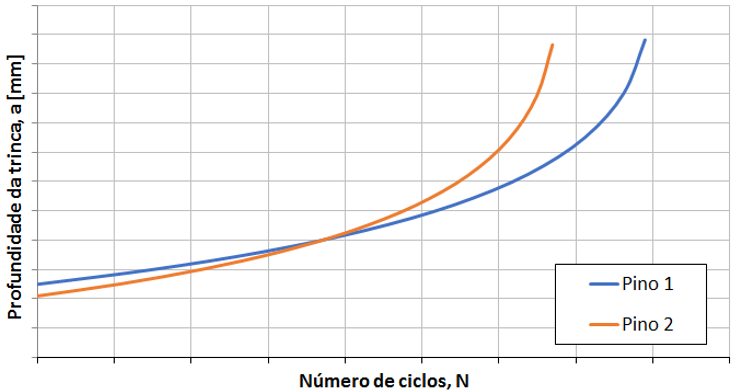
Figure 12 – Variation in crack depth as a function of the number of cycles.
Fracture mechanics analysis of SAG and ball mills
Kot Engenharia static and fatigue checks, considering fracture mechanics, on SAG and ball mills, including cylinders, covers, flanges, and trunnions.
To determine the maximum stresses acting on the various components of the mill, the most critical combinations obtained in análise por elementos finitos were used. The service life of the welds between the body flanges and covers, as well as between the covers and trunnions, was verified using fracture mechanics techniques.
Both mills were analyzed considering the deformation of the structure after the application of loads (see Figure 13), the deformation of various regions after crack propagation (see Figure 14), and the stress state at the crack tip (see Figure 15). For each of the regions analyzed by fracture mechanics in the mills, a crack propagation calculation was performed to determine the life.
Based on the results, monitoring and inspection measures were recommended for the assets.
![Figure 13 – Ball Mill Displacements [mm].](https://kotengenharia.com.br/wp-content/uploads/2026/02/fig13.png.webp)
Figure 13 – Ball Mill Displacements [mm].
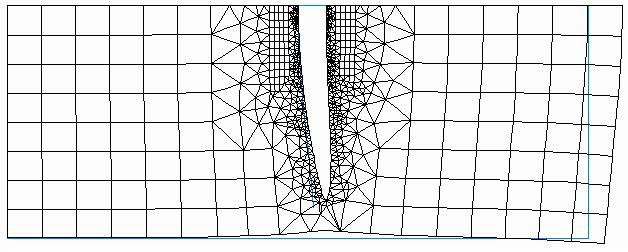
Figure 14 – Deformation of the region of interest after crack propagation.
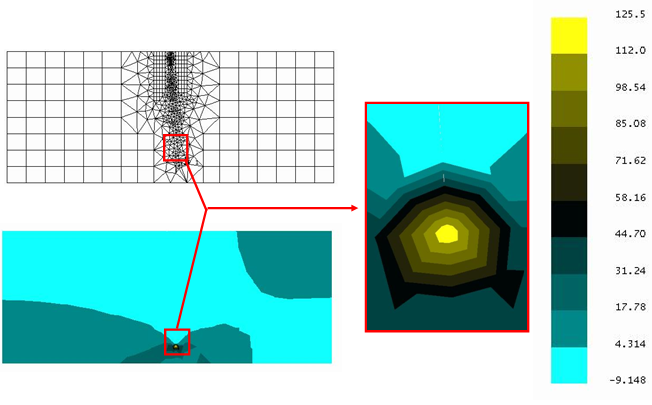
Figure 15 – Stress field in the region of interest after crack propagation.
Conclusion
Structural fatigue remains one of the main challenges of modern industrial engineering, especially in equipment subjected to cyclic loading and long periods of operation. Practical experience shows that traditional analyses are not always sufficient to capture the failure mechanisms present in real structures.
In this sense, Linear Elastic Fracture Mechanics stands out as a robust and reliable tool for assessing Structural Integrity, estimating remaining useful life, and supporting technical decisions related to the inspection, maintenance, and safe operation of industrial equipment. The existence of cracks in a structure does not always require immediate intervention or even equipment shutdown.
Kot Engenharia in the application of advanced calculation methodologies, combining regulatory knowledge, computational analysis, and practical experience to support its clients in preventing failures, increasing operational reliability, and optimizing maintenance costs.
To learn how these solutions can be applied to your assets, please contact our team.
Follow our pages on LinkedIn, Facebook and Instagram and keep up with our content.