Introduction
The Discrete Element Method (DEM) is a widely used tool for simulating the behavior of bulk materials of various shapes and sizes in equipment such as silos, hoppers, and transfer chutes. In this sense, DEM allows the operation of the asset to be represented numerically after correlating the model with the data of the asset under analysis. This makes it possible to identify flow patterns and physical parameters that would be difficult to obtain during operation. Furthermore, the method also enables the study of changes in geometry and operating parameters without the need to shut down the equipment or use physical prototypes.
Case
In this context, at a client’s request, Kot Engenharia this method to perform a flow analysis on a cooling bed for iron ore pellets. The primary objective of the study was to identify possible causes of insufficient cooling of a section of material along the cooler. As shown, Figure 1 presents the equipment, as well as its main components related to material flow.
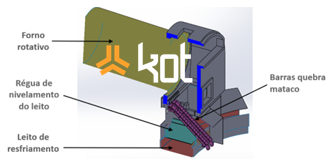
Figure 1: Geometry used in the analysis and its main components. Source: Kot Collection.
Subsequently, based on reports from the operations team and images obtained in the field, it was observed that, at the outlet of the cooling bed, a portion of the material was not being cooled properly. Consequently, it was noted that high-temperature material was repeatedly found near the outer wall of the bed, as shown in Figure 2.

Figure 2: Identification of the insufficient cooling region. Source: Kot Collection.
In this regard, with respect to the material used in the model, since it is not possible to collect and handle the pellets under operating conditions, the DEM model was calibrated using data on the material at room temperature. Figure 3 shows a view comparing the trajectory of the pellets at the furnace outlet with the trajectory of the material in the DEM model.

Figure 3: Comparison of pellet trajectories. Source: Kot Collection.
Given this situation, based on an assessment of the process and the equipment, two hypotheses were formulated regarding the strip of material that was not cooling as expected. In this regard, the two possibilities considered are:
-
- Irregularities in the height of the material bed;
-
- Non-uniform porosity of the pellet bed.
The DEM model run to evaluate pellet bed formation, which can be viewed in Video 1, shows the filling stage and the start of cooler operation.
Video 1: Bed filling. Source: Kot Collection.
Next, this model aimed to determine the height of the material layer across the width of the bed. Thus, based on the results of the DEM analysis, it was possible to assess the uniformity of the height, as shown in Figure 4.
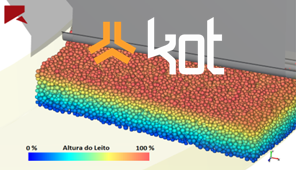
Figure 4: Height of the pellet bed in the cooler. Source: Kot Collection.
However, after ruling out the possibility of variations in bed height, the next hypothesis sought to assess the non-uniformity of the pellet bed’s porosity. According to the customer’s reports and sampling data from the bulk material downstream of the cooler, the cooling problems were linked to an increase in the proportion of finer-grained particles.
In fact, it is well known that particle size segregation can occur at the furnace outlet, resulting in significantly different trajectories for each pellet size and, consequently, leading to the formation of a non-uniform bed. If there is a higher concentration of fines in a specific region of the cooler, the airflow in that section would be impaired, and consequently, the heat transfer capacity of the pellets in that segment would also be reduced. Thus, greater particle variability was implemented in the DEM model, following the particle size distribution ratio provided by the client. Figure 5 presents the flow analysis in the model as a function of particle diameter.
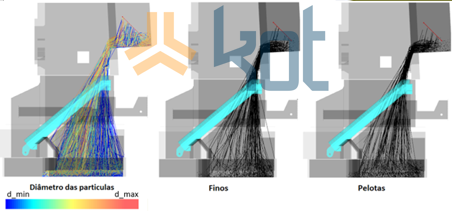
Figure 5: Flow analysis. Source: Kot Collection.
As a result, the model with the greatest particle size variability indicated that particles with smaller diameters tend to settle on the outer side of the cooling bed, coinciding with the region where the material cools most poorly. Therefore, the bed composition was evaluated, with Video 2 showing the number of particles in each radial segment of the bed. In this sense, this parameter is related to the bed’s porosity, since a region with a higher number of particles implies greater filling of this section’s volume and, consequently, a smaller fraction of empty spaces.
Video 2: Particle counting. Source: Kot Collection.
Conclusion
In summary, the analysis of the pellet bed conducted using a DEM model indicated that the section with the highest number of particles—and consequently the highest porosity—coincides with the region experiencing the poorest cooling, highlighting this factor as the cause of the problems reported by the client. By identifying the source of the problem using computational tools, Kot was able to support its client by obtaining the necessary information to develop and implement more targeted solutions, optimizing resource use and enabling significant improvements in their process.
The Kot team has qualified professionals at your disposal to evaluate and perform a wide range of consulting engineering analyses. Consult our team for more information!
Follow our pages on LinkedIn, Facebook e Instagram to keep up with our content.