Introduction
Rail vehicles are complex mechanical systems composed of hundreds of moving parts that interact with one another through friction forces, damping systems, and unstable operating conditions. A company renovated its passenger car fleet by acquiring models that meet European standards; this fleet was designated as “modern.” In this context, since other types of cars were already in service, there was a need for these modern vehicles to operate alongside cars from the classic fleet, as well as to determine the comfort level of this mixed formation in operation. Thus,with the aim of evaluating passenger comfort during rail travel, an international standard establishes guidelines for assessing the parameters to which passengers are subjected. Consequently, these normatively defined criteria must be studied using the accelerometry method.
First, the comfort analysis of the passenger car involved evaluating a complete trip cycle and a trip in the opposite direction under normal operating conditions. The first cycle took place with the classic fleet car in the last position and the modern passenger car, equipped with accelerometers, in the second-to-last position of the train, as shown in Figure 1. Subsequently, at the end of the first cycle, the cars swapped positions, as can be seen in Figure 2.
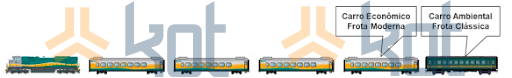
Figure 1: Position of the passenger car in the first cycle.

Figure 2: Position of the passenger car in the second cycle.
In addition, the vehicles were equipped with 3-axis accelerometers, as shown in Figure 3.
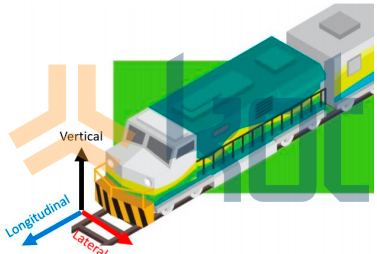
Figure 3: Illustration of acceleration directions.
Consequently, to ensure an accurate correlation between the measured load and strain, the test rig was calibrated on a test bench using hydraulic cylinders. For example, Figure 4 shows the sensor locations and the calibration of the test rig.
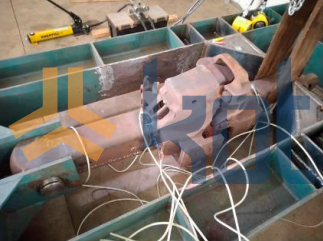
Figure 4: Extensometers installed in the coupling during calibration.
The data acquisition system was then connected to an onboard computer, which recorded the data in a text file format, along with the GPS data. In addition, the results were analyzed in accordance with international standards. The results obtained during the calibration of the hitch are shown in Figure 5.
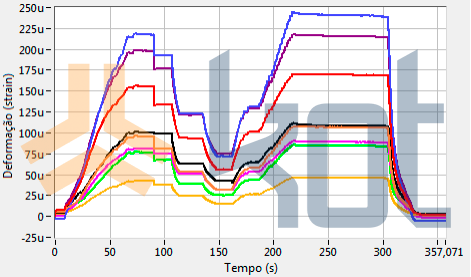
Figure 5: Calibration results of the coupling deformations.
The results obtained during the two cycles are then presented graphically. The X-axis represents the time domain, point by point along the track. Figure 6, in red, shows the NMV values for the first cycle of the modern passenger car, while the graph in black shows the NMV values for the classic car.
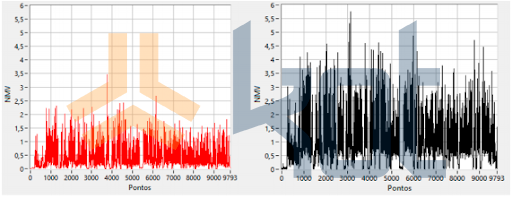
Figure 6: NMV results for the modern passenger car and the classic car, respectively, in the first measurement cycle.
Figure 7, in red, shows the NMV values of the second cycle for the modern passenger car, while the graph in black shows the NMV values for the classic car.
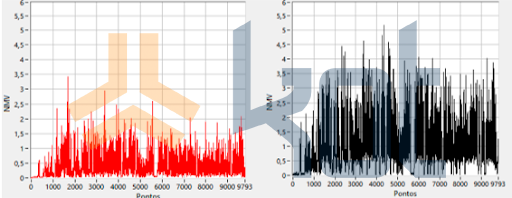
Figure 7: NMV results for the modern passenger car and the classic car, respectively, in the second measurement cycle.
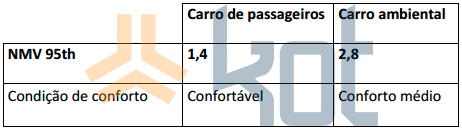
In summary, it can be seen that the NMV values for the classic car are higher than those for the modern car in both cycles. By evaluating the results obtained in the two cycles and using the 95th percentile of these results as a reference, we obtain the comfort value, in accordance with international standards, as shown in Table 1.
Table 1: General comfort.
Conclusion
In conclusion, the comfort assessment of the passenger car allowed for the determination of NMV values. The primary accelerations that contribute to increased discomfort in modern cars are vertical accelerations. On the other hand, for the classic car, it is both vertical and lateral accelerations. Furthermore, there was no significant variation in either of the evaluated cycles, indicating that comfort levels do not change depending on the position of the cars.
Kot has experience in this area and can help you with your company's needs. Contact our team for more information!
Follow our pages on LinkedIn, Facebook e Instagram to keep up with our content.
References:
[1] DYNAMIC BEHAVIOR OF THE EFVM PASSENGER TRAIN WITH DIFFERENT MODELS OF CARS IN THE COMPOSITION.