Mechanical vibration analysis is now a highly developed technique, but conventional methods have their limitations. With the advent of image-based vibration measurement, the potential for developing engineering solutions has increased considerably.
The use of vibration analysis systems not only reduces maintenance costs, but also enables technicians and engineers to improve their knowledge and automatically define what improvements need to be made to machines so that they become highly reliable and robust to wear. Read on and find out more about the methodology.
Vibration Study
The study of vibrations is of fundamental importance to modern engineering, because through their use in machinery and equipment it is possible to understand them, improve them and obtain substantial gains in quality, productivity and development.
When new equipment is put into operation, it is expected to have a long life and to have as few non-conformities as possible. However, deficiencies in design, specification errors, manufacturing, transportation, installation, condition, operation and maintenance can make equipment and installations unreliable.
Generally, mechanical faults arising from the operation of a piece of equipment have specific frequency bands in the spectrum which are related to certain faults. These bands are parameters that are multiples and submultiples of the operating speed, or excitation, of the equipment. Figure 1 shows a vibration spectrum, divided into frequency bands.
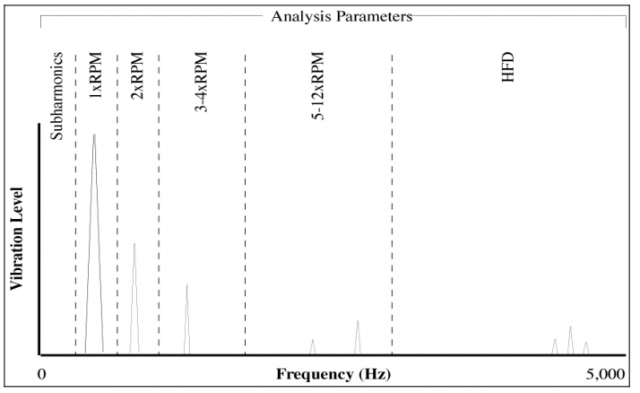
Figure 1: Example of a frequency spectrum - SOURCE: BERRY, James E. - 1997.
Figure 1 shows that the characteristic frequencies of mechanical failures are usually related to the defects as follows:
- 1 x RPM = Unbalance;
- 2 x RPM = Misalignment;
- 1, 2, 3, 4 and 5 x RPM = Mechanical clearances;
- 0.5 x RPM = Excessive friction between.
It is important to note that most mechanical vibration measurement systems use accelerometers that perform adequately over a wide frequency range.
Although they can be used in a wide range of situations, accelerometers usually have marginal performance for frequencies below 2 Hertz or 120 CPM due to the large amount of noise generated by the Fast Fourier Transform (FFT).
Unfortunately, most of the problems related to resonance in mechanical systems, problems with fixing bases and structural instability are problems that manifest themselves at low frequencies, usually below 2 Hz. As a result, the correct characterization of these phenomena was uncertain and often incorrect, which led to expensive repairs that were unreliable.
SDG analysis
According to SCHWARZ and RICHARDSON (1999), ODS (Operational deflection shapes) are generally defined as the deflection of a structure at a given frequency. However, an ODS can be defined more generally as any forced movement of two or more points on a structure. In this way, the movement of two or more points defines a shape. Thus, a shape is the movement of one point in relation to all the others. Therefore, movement is a vector quantity, which means that it has location and direction associated with it. This is defined as a Degree of Freedom or GDL. The six GDLs that describe the movement behavior of an object can be seen in Figure 2.

Figure 2: The six degrees of freedom (GDL) that describe the movement behavior of an object - SOURCE: ZENG, 2012.
According to RICHARDSON (1997), an ODS can be defined as any forced movement, either at a moment in time or at a specific frequency.
Therefore, an ODS can be obtained from different types of time domain responses, be they random, impulsive or sinusoidal. An ODS can also be obtained from many different types of frequency domain measurements, including linear spectra (FFTs), cross and auto power spectra, FRFs(Frequency Response Functions), transmissibilities and a special type of measurement called an FRF ODS.
According to GANERIWALA, SCHWARZ and RICHARDSON (2009), an ODS is generally defined as a magnitude and phase value for each GDL that is measured in a machine or structure. This methodology requires all responses to be measured simultaneously or to be measured under conditions that guarantee their correct magnitudes and phases in relation to each other. Simultaneous measurement requires a multi-channel acquisition system that can acquire all the responses simultaneously. And this is precisely where Kot's image processing solution comes into its own.
Vibration measurement by image processing
One of the most promising options for solving low-frequency and multi-channel measurement is high-speed camera vibration testing, a system in which small films are generated that measure the actual displacement of the structure. These films are processed by specific software and the end result is waveforms, vibration spectra and amplified videos.
Image vibration measurement systems consist of:
- High-speed camera for image acquisition;
- Lenses for the camera;
- Lighting system and support;
- Computer for film acquisition and subsequent processing.
With this system, you can measure the displacements of structures and the waveforms generated at certain points according to the loads applied.
Using the camera, it is possible to measure several points simultaneously, as long as they are framed in the same image, eliminating the need to interpolate values. In addition, there is no need to stop the equipment to install sensors and the measurement is made at a safe distance from the asset.
A case of Kot's use of the camera can be seen in Gif 1 below.
Gif 1: Measuring vibration in a tank with a motion amplification camera - SOURCE: Kot Collection.
Finally, like any vibration analysis system, data analysis is of fundamental importance and extremely dependent on the qualifications of the team of vibration analysts. An adequate solution to the problem will only be possible with a trained and qualified team. If your company has any vibration analysis needs, contact our team for more information!
Follow our pages on LinkedIn, Facebook e Instagram to keep up with our content.
References
BERRY, James E. Analysis I: How to Implement An Effective Condition Monitoring Program using Vibration Analysis. Technical Associates of Charlotte, PC, 1997.
SCHWARZ, Brian J.; RICHARDSON, Mark H. Introduction to operating deflection shapes. CSI Reliability Week, v. 10, p. 121-126, 1999.
ZENG, Hansong. Bio-Inspired Inertial Sensors for Human Body Motion Measurement. 2012. Doctoral dissertation. The Ohio State University.
RICHARDSON, Mark H. et al. Is it a mode shape, or an operating deflection shape? Sound and Vibration, v. 31, n. 1, p. 54-67, 1997.
ASNAASHARI, Erfan; SINHA, Jyoti K. Operational deflection shape for crack detection in structures. In: Key Engineering Materials. Trans Tech Publications Ltd, 2013. p. 1085-1092.
GANERIWALA, Surendra N.; SCHWARZ, Brian; RICHARDSON, Mark H. Operating deflection shapes detect unbalance in rotating equipment. Sound and Vibration, v. 43, n. 5, p. 11-13, 2009.